


Abstract
Skull morphology is fundamental to evolution and the biological adaptation of species to their environments. With aquaculture fish species, head size is also important for economic reasons because it has a direct impact on fillet yield. However, little is known about the underlying genetic basis of head size. Catfish is the primary aquaculture species in the United States. In this study, we performed a genome-wide association study using the catfish 250K SNP array with backcross hybrid catfish to map the QTL for head size (head length, head width, and head depth). One significantly associated region on linkage group (LG) 7 was identified for head length. In addition, LGs 7, 9, and 16 contain suggestively associated regions for head length. For head width, significantly associated regions were found on LG9, and additional suggestively associated regions were identified on LGs 5 and 7. No region was found associated with head depth. Head size genetic loci were mapped in catfish to genomic regions with candidate genes involved in bone development. Comparative analysis indicated that homologs of several candidate genes are also involved in skull morphology in various other species ranging from amphibian to mammalian species, suggesting possible evolutionary conservation of those genes in the control of skull morphologies.
Skull morphology and body conformation are fundamental to evolution and the biological adaptation of species to their environments. Species evolve to have different head shapes and sizes in response to their environments, and in relation to their behavior and mode of survival. As such, skull morphology and body conformation have been extensively studied in various species. Wunnenberg-Stapleton et al. (1999) first reported the involvement of small GTPases (Ras homolog gene family member A and Ras homolog gene family member S) in the control of head formation in Xenopus. Later, a number of studies were conducted in canines. As a companion species, dogs have been artificially bred and selected to have hundreds of breeds, with various overall sizes and various head shapes and sizes (Schoenebeck and Ostrander 2013). The finding that selection of a single gene, insulin-like growth factor I, is largely responsible for the huge variations in shapes and sizes in dogs astonished many scientists (Sutter et al. 2007). Since then, great efforts have been devoted to the analysis of head shapes and sizes in dogs in order to understand the genomic basis underlying the large differences (Schoenebeck and Ostrander 2013). Genome-wide association studies (GWAS) have allowed the mapping of quantitative trait loci (QTL) controlling head shapes in eight chromosomes in dogs. As the canine reference genome is available, further analysis of the QTL regions has allowed the identification of candidate gene bone morphogenetic protein 3 (BMP3) for skull shapes (Schoenebeck et al. 2012). Recently, seven QTL were identified for skull size and 30 QTL were identified for skull shape in mice (Maga et al. 2015).
With aquaculture fish species, analysis of head sizes is important not only for understanding evolution and biological adaptation, but also for economic reasons. Head shapes and sizes influence fillet yield directly. Smaller head and uniform body conformation provide a greater proportion of fillet, thus selection for smaller head and uniform body conformation is of great aquaculture value (Rutten et al. 2005). For example, compared with blue catfish, channel catfish has a relatively larger head and lower fillet yield ratio (Argue et al. 2003).
QTL linkage mapping analysis of body shape has been conducted in fish species including common carp (Laghari et al. 2014) and sea bass (Massault et al. 2010). However, limited by the number of markers, these findings are far from the requirements of marker-assisted selection (MAS), and little is known about genetic mechanisms for head shapes and sizes with aquaculture species. Channel catfish (Ictalurus punctatus) is the major aquaculture species in the United States. In recent years, hybrid catfish, produced by mating female channel catfish with male blue catfish (I. furcatus), has become the breed of choice because the F1 hybrid exhibits a number of superior traits due to heterosis including: faster growth, enhanced disease resistance, and greater fillet yield (Argue et al. 2003; Dunham et al. 2008). Channel catfish in general has a relatively larger head than blue catfish. Therefore, the channel catfish × blue catfish hybrid system offers a great model to study head shapes and sizes. Understanding of genomic regions for head shapes and sizes in catfish would allow us to discover controlling mechanisms. In addition, the linked markers will allow MAS or marker-guided introgression. Although traditional selective breeding has been used to enhance processing yield in catfish, the progress has been limited due to low selection intensity, low accuracy, and low heritability (Argue et al. 2003).
GWAS has been regarded as a powerful strategy for the identification of markers associated with traits of interest with high resolution, and it has been conducted in aquaculture species recently (Geng et al. 2015; Ayllon et al. 2015; Tsai et al. 2015, 2016; Sodeland et al. 2013; Correa et al. 2015, 2016; Jin et al. 2016; Gutierrez et al. 2015). Recent development of a number of genomic resources has made such work feasible in catfish, including the channel catfish reference genome sequence (Liu et al. 2016), a large number of SNPs (Sun et al. 2014), and the 250K SNP array (Liu et al. 2014). In this study, we explored the genetic architecture for catfish head size using GWAS, and here we report the identified QTL and the genes within the highly associated genomic regions.
Materials and Methods
Ethics statement
All experiments involving the handling and treatment of fish were approved by the Institutional Animal Care and Use Committee (IACUC) at Auburn University. Blood was collected after euthanasia. All animal procedures were carried out according to the Guide for the Care and Use of Laboratory Animals and the Animal Welfare Act in the United States.
Experimental fish and sample collection
The study population was the Auburn University 1-yr-old catfish generated from backcross of male F1 hybrid catfish (female channel catfish × male blue catfish) with female channel catfish. The female channel catfish were collected from the Marion strain (Dunham and Smitherman 1984), including the female parents of the F1 hybrid catfish. The population consisted of nine families (Supplemental Material, Figure S1 and Table S1). The offspring were mixed for communal culture. In order to assign the fish to each family, cluster analysis was conducted according to the IBS kinship matrix based on their genotypes (Geng et al. 2015). In total, 556 fish (average body weight 50.8 g ranging from 13 to 180 g) were randomly obtained from Auburn University Fish Genetics Facility and blood samples were collected. The head size, including head length, head width, and head depth, was measured at one time-point as the trait of interest (Figure S2). Head length is the horizontal distance between the maxillary symphysis and the posterior bony edge of the operculum. Head width is the distance between the two sides of the posterior bony edges of the operculum. Head depth is the vertical distance from top to bottom of the skull across the posterior bony edge of the operculum.
DNA isolation, genotyping, and quality control
DNA was isolated from blood samples using standard protocols. After incubated at 55° for ∼10 hr, the blood cells were broken by cell lysis solution. Protease K and protein precipitation solution were used to remove the proteins. Next, DNA was precipitated by isopropanol and collected by brief centrifugation, washed twice with 70% ethanol, air-dried, and resuspended in TE buffer (pH 8.0). After being quantified using spectroscopy by Nanodrop (Thermo Scientific) and checked by 1% agarose gel electrophoresis stained with ethidium bromide for integrity, DNA was diluted to 50 ng/μl.
A catfish 250K SNP array has been developed using Affymetrix Axiom genotyping technology with markers distributed across the catfish genome at an average interval of 3.6 kb (Liu et al. 2014). Genotyping using the catfish 250K SNP array was performed at GeneSeek (Lincoln, Nebraska). No sample was excluded due to low quality or low call rate (<95%). 218,784 SNPs were kept after filtering out SNPs with genotyping error based on Mendelian laws, a minor allele frequency (MAF) <5%, or a call rate <95%.
Statistical analysis
To determine which individual SNPs were associated with head size, a single SNP test was performed on all markers. Statistical analysis was carried out using the SVS software package (SNP & Variation Suite, Version 8.0) and PLINK (Version 1.07) (Purcell et al. 2007). The threshold P-value for genome-wide significance was calculated using Bonferroni correction based on the estimated number of independent markers and linkage disequilibrium (LD) blocks. LD pruning was conducted with a window size of 50 SNPs, a step of 5 SNPs, and r2 threshold of 0.2. Assuming each LD block represents one independent set of markers, the number of independent SNPs and LD blocks was 14,391. The significance level for genome-wide significance was set as 0.05 / 14,391 = 3.47e−6 [−log10(P-value) = 5.46] based on Bonferroni correction. The threshold of −log10(P-value) for suggestive association was arbitrarily set as 5. To visualize the sample structure, principal component analysis with the independent SNP markers was conducted and the plots representing the sample structure were constructed with the first three principal components (Figure S1).
Manhattan plots were produced using the SVS software. The genetic marker map was constructed according to channel catfish genome sequence (version Coco1.0, Liu et al., unpublished results), since genome architectures of channel catfish and blue catfish are extremely similar with the same sets of parallel chromosomes according to our former studies and unpublished data (Liu et al. 2003; Kucuktas et al. 2009; Ninwichian et al. 2012). The data sets including the phenotypes, genotypes, and marker information are available at https://figshare.com/s/7ad1c3f2a3d3cca9fcbe, which are bed files for analyses in PLINK and SVS.
Sequence analysis
The ±1 Mb regions surrounding the most significant SNP out of each QTL were examined for candidate genes according to their locations and functions. The genes within the genomic regions were predicted using FGENESH (Solovyev et al. 2006) and annotated by BLAST analysis against the nonredundant protein database (Pruitt et al. 2007; Altschul et al. 1990).
Data availability
The authors state that all data necessary for confirming the conclusions presented in the article are represented fully within the article.
Results
Phenotypes
A summary of the original observations and adjusted phenotypes for head length, head width, and head depth is shown in Table 1. Phenotypes were not normally distributed because the phenotypes segregated in the backcross generation. To cover individuals with a wide range of body size, samples were utilized with body weights varying from 13 to 180 g. Body weight could explain over 70% variance for all the three traits based on the coefficient of determination of linear regression.
Summary of original observation and adjusted phenotype for three traits
| Original Observation | Adjusted Phenotype | |||||||
|---|---|---|---|---|---|---|---|---|
| Mean | SD | Min | Max | Mean | SD | Min | Max | |
| Body weight (g) | 50.8 | 23.9 | 13 | 180 | — | — | — | — |
| Head length (cm) | 3.36 | 0.49 | 1.97 | 5.16 | 0 | 0.23 | −0.77 | 0.51 |
| Head width (cm) | 2.47 | 0.39 | 1.44 | 4.10 | 0 | 0.16 | −0.75 | 0.47 |
| Head depth (cm) | 2.28 | 0.41 | 1.23 | 3.75 | 0 | 0.22 | −0.65 | 0.83 |
N = 556. Min, minimum; Max, maximum.
| Original Observation | Adjusted Phenotype | |||||||
|---|---|---|---|---|---|---|---|---|
| Mean | SD | Min | Max | Mean | SD | Min | Max | |
| Body weight (g) | 50.8 | 23.9 | 13 | 180 | — | — | — | — |
| Head length (cm) | 3.36 | 0.49 | 1.97 | 5.16 | 0 | 0.23 | −0.77 | 0.51 |
| Head width (cm) | 2.47 | 0.39 | 1.44 | 4.10 | 0 | 0.16 | −0.75 | 0.47 |
| Head depth (cm) | 2.28 | 0.41 | 1.23 | 3.75 | 0 | 0.22 | −0.65 | 0.83 |
N = 556. Min, minimum; Max, maximum.
Determination of optimal model for analysis: EMMAX vs. QFAM
The Manhattan plots generated from EMMAX and QFAM are shown in Figure 1 and Figure 2. Both of the methods could correct family structure efficiently. Generally, the association results generated by EMMAX and QFAM were positively correlated, but QFAM provided more statistical power than EMMAX with our family-based samples. In the following sections, we will describe the characters of identified regions according to the results generated from QFAM.
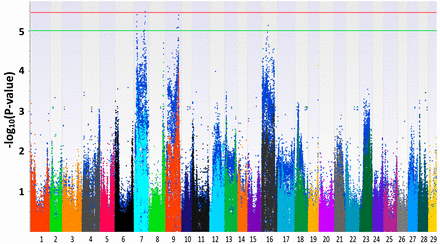
Manhattan plots for head length. The plots in different colors in the front layer were generated from EMMAX (Efficient Mixed-Model Association eXpedited) and the plots in blue in the back layer were generated from QFAM (family-based association test for quantitative traits).
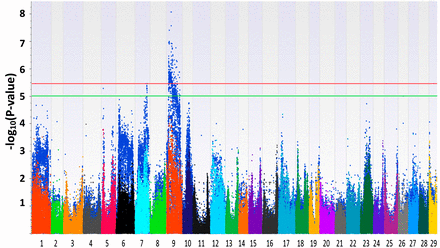
Manhattan plots for head width. The plots in different colors in the front layer were generated from EMMAX (Efficient Mixed-Model Association eXpedited) and the plots in blue in the back layer were generated from QFAM (family-based association test for quantitative traits).
Genomic regions associated with head size
For head length, one significantly associated SNP was identified around position 22 Mb of LG7 (Figure 1 and Table 2). The −log10(P-value) of the most significant SNP reached 5.46. Three LGs (LG7, LG9, and LG16) were found to contain QTL suggestively associated with head length (Figure 1, Figure S3, and Table 2). For head width, LG9 harbored significant SNPs (Figure 2, Figure S4, and Table 3). Two more regions on LG5 and LG7 were suggestively associated with head width (Table 3). For head depth, no SNP with −log10(P-value) > 5 was identified (Figure S5). Several associated regions could extend a long distance. It may be caused by two or more candidate genes with a long interval that were located in the associated regions, just like the case shown in Figure S3, Table 2, and Table 3. Another reason may be that the recombination rate to break the linkage of nearby loci in the backcross progenies is low.
Information of regions associated with head length
LG, linkage group; SNP, single nucleotide polymorphism; ID, identifier.
Means the candidate genes are small GTPase or related to small GTPases in function.
Means the paralogs of the candidate genes were identified.
LG, linkage group; SNP, single nucleotide polymorphism; ID, identifier.
Means the candidate genes are small GTPase or related to small GTPases in function.
Means the paralogs of the candidate genes were identified.
Information of regions associated with head width
| LG | SNP ID | SNP Position | β | −log10(P) | % Variance | Gene Position (kb) | Gene Name | Reference |
|---|---|---|---|---|---|---|---|---|
| 9 | 85362293 | 8919023 | 0.09 | 8.06 | 3 | 8993–9042 | snx25a | Parks et al. 2001 |
| 85220262 | 4755583 | −0.09 | 7.40 | 4034–4038 | pcdh20a,b | Unterseher et al. 2004; Wunnenberg-Stapleton et al. 1999 | ||
| 4058–4061 | rab9ba,b | Itzstein et al. 2011 | ||||||
| 4498–4522 | ablm3 | Dos Remedios et al. 2003 | ||||||
| 7 | 85994489 | 22981883 | 0.06 | 5.45 | 2 | 22,522–22,536 | nudt3 | Shears et al. 2011 |
| 23,035–23,041 | gnb1ba | Gong et al. 2010; Quarles and Siddhanti 1996 | ||||||
| 23,161–23,168 | gnai2ba | Gong et al. 2010; Quarles and Siddhanti 1996 | ||||||
| 23,547–23,552 | gnat1a | Gong et al. 2010; Quarles and Siddhanti 1996 | ||||||
| 5 | 85206630 | 3471449 | −0.10 | 5.27 | 3 | 3913–3940 | itb3ba | Ross et al. 1993 |
| 3942–3956 | synpo2la | Asanuma et al. 2006 | ||||||
| 4203–4208 | galr2 | McDonald et al. 2007 |
LG, linkage group; SNP, single nucleotide polymorphism; ID, identifier.
Means the candidate genes are small GTPases or related to small GTPases in function.
Means the paralogs of the candidate genes were identified in the regions associated with head length.
| LG | SNP ID | SNP Position | β | −log10(P) | % Variance | Gene Position (kb) | Gene Name | Reference |
|---|---|---|---|---|---|---|---|---|
| 9 | 85362293 | 8919023 | 0.09 | 8.06 | 3 | 8993–9042 | snx25a | Parks et al. 2001 |
| 85220262 | 4755583 | −0.09 | 7.40 | 4034–4038 | pcdh20a,b | Unterseher et al. 2004; Wunnenberg-Stapleton et al. 1999 | ||
| 4058–4061 | rab9ba,b | Itzstein et al. 2011 | ||||||
| 4498–4522 | ablm3 | Dos Remedios et al. 2003 | ||||||
| 7 | 85994489 | 22981883 | 0.06 | 5.45 | 2 | 22,522–22,536 | nudt3 | Shears et al. 2011 |
| 23,035–23,041 | gnb1ba | Gong et al. 2010; Quarles and Siddhanti 1996 | ||||||
| 23,161–23,168 | gnai2ba | Gong et al. 2010; Quarles and Siddhanti 1996 | ||||||
| 23,547–23,552 | gnat1a | Gong et al. 2010; Quarles and Siddhanti 1996 | ||||||
| 5 | 85206630 | 3471449 | −0.10 | 5.27 | 3 | 3913–3940 | itb3ba | Ross et al. 1993 |
| 3942–3956 | synpo2la | Asanuma et al. 2006 | ||||||
| 4203–4208 | galr2 | McDonald et al. 2007 |
LG, linkage group; SNP, single nucleotide polymorphism; ID, identifier.
Means the candidate genes are small GTPases or related to small GTPases in function.
Means the paralogs of the candidate genes were identified in the regions associated with head length.
Candidate genes within the QTL regions for head size
The ±1 Mb regions around the most significant SNP of each QTL were examined for genes within the genomic regions. Candidate genes for head length on the associated regions were identified with known function related to bone development (Table 2). Interestingly, paralogs of the candidate genes were identified within the associated regions in catfish, including genes coding for small GTPase, sphingomyelin phosphodiesterase, fibroblast growth factor-binding protein, and regulator of G-protein signaling (Table 2).
Some candidate genes for head width on LGs 5, 7, and 9 are also involved in bone development (Table 3). Some paralogs of candidate genes for head length were identified in the regions associated with head width as well, including protocadherins 20 and Ras-related protein Rab 9b. Of course, the other genes within associated QTL might have unknown related functions, and they cannot be excluded as potential functional units affecting head size.
Ratio of phenotypic variance explained by associated SNPs
The ratio of phenotypic variance explained by associated SNPs of head size in our population was estimated by EMMAX. Because of high correlation among SNPs on the same LG, only the most significant SNP on each associated LG was chosen for analyzing the fraction of phenotypic variance explained by the QTL. Thus, the ratio of phenotypic variance explained may be underestimated. Moreover, the calculated fraction may change with different population or sample sizes. The fraction of variance of head length that could be explained by the most significant SNP on LG7 is 0.02. In addition, the other suggestively associated regions could explain 0.05 in total (Table 2). The proportion of explained head width variance was 0.08 in total from significantly associated QTL and suggestively associated QTL (Table 3).
Conditioned analysis results
Conditioned analyses were conducted to examine the correlation of the SNPs associated with head size. The association test was conducted with the most significant SNPs on each LG as a covariate (one SNP at a time). Because of the lack of recombination among SNPs on the same LG in the backcross population, the −log10(P-value) of SNPs on the same LG with the SNP included as covariate dropped drastically after conditioning, implying that the SNPs on the same LG were highly correlated. For example, after the most significant SNP for head length on LG9 (ID 85413092) was included in the association test, the −log10(P-value) of SNPs on LG9 all dropped below two, while the P-value of SNPs on the other LGs generally did not change. Similar results were obtained for other associated SNPs. Due to potential errors in genome sequence assembly, a false positive QTL could be mapped on a wrong position. The significant SNPs are independent to those on different LGs, which proved that no associated QTL was identified on a wrong LG caused by incorrect scaffolding in the reference genome sequence (Liu et al. 2016).
Discussion
Head shape is important not only for understanding evolutionary adaptation, but also for aquaculture reasons of catfish. Smaller heads are beneficial for aquaculture production and profit margins. In this work, we used the high density 250K catfish SNP array and the backcross progenies for mapping QTL controlling head size.
Several genes were previously known to control skull shape and size in fish, frog, dog, mouse, and human, which are functionally related to the candidate genes reported here. For instance, bmp4 was reported to play an important role in coordinating shape differences in the cichlid fish oral jaw apparatus (Albertson et al. 2003). It was reported that small GTPases are important to cell adhesion and head formation in early Xenopus development (Wunnenberg-Stapleton et al. 1999). In humans, mutations affecting FGFR, RAB, and TGFBR are associated with defects within the developing skull (Schoenebeck and Ostrander 2013). In dogs, eight QTL were reported to be associated with skull diversity, and it was demonstrated that BMP3 contains a likely causal variant (Schoenebeck et al. 2012). In addition to BMP3, we searched the other associated regions for candidate genes surrounding the proposed significant SNPs in dogs (Schoenebeck et al. 2012). In doing so, many candidate genes were identified, coding for proteins including small GTPase, Ras guanine nucleotide exchange factor 1b (RASGEF1B), integrin alpha 11 (ITGA11), fibroblast growth factor 5 (FGF5), kinesin-like protein (KIF), and insulin-like growth factor 1 (IGF1) (Figure 3). It is notable that some homologs were identified associated with head size in catfish. Similarly, Itga2, Arhgap31, Gnai3, Fgfr3, Chd7, and Kif7 were identified within the QTL linked with mouse skull shape (Maga et al. 2015). Close to Gnai3, Itga2, and Chd7, we also found Gnat2, Itga1, Fst, and Rab2a according to the mouse genome sequence (Figure 3). By examining the genomic regions associated with head shape in catfish, dog, and mouse (Figure 3), it is clear that all the identified genes were not orthologous. Therefore, it appears that it is not orthologous genes that explain the variance of head shape in different species. The first reason may be that different landmarks were utilized to describe the head shape in three studies. Second, maybe not all the orthologous genes contain variants that could affect the phenotype in the sampled population within three species or could be mapped, even if they are involved in head shape in the three species.
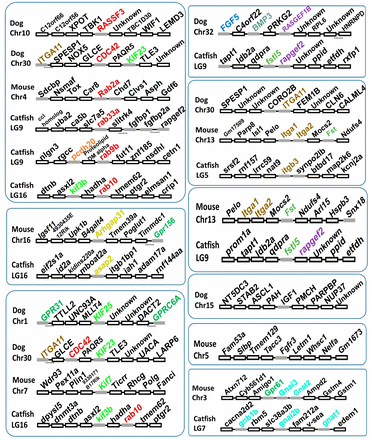
Regional scan of QTL associated with head shape identified in mouse and dog (Schoenebeck et al. 2012; Maga et al. 2015). The homologs of mouse and dog candidate genes within the associated QTL in catfish were also shown. Homologs were marked in the same color. Solid gray boxes indicate candidate genes. Dash lines under the boxes indicate several genes located in the interval are not shown. Chr, chromosome; LG, linkage group; QTL, quantitative trait loci.
It is also notable that some paralogs, including Ras-related protein, small GTPase-activating protein, and sphingomyelin phosphodiesterase, were enriched in the regions associated with head size on different LGs (Table 2 and Table 3). For example, 52 Rab GTPase genes were identified out of the whole channel catfish genome (Wang et al. 2014), which was predicted to contain 26,661 protein-coding genes (Liu et al. 2016). In the nine associated QTL containing about 420 genes, three Rab genes were identified, which is more than would be expected by chance (P < 0.05).
In addition to the enriched Rab genes, most candidate genes are functionally related to small GTPase (Figure S6, Table 2, and Table 3). Small GTPases are reported to be involved in bone morphogenesis with a variety of functions, including the dynamics of the actin cytoskeleton, cell adhesion, and membrane trafficking (Wunnenberg-Stapleton et al. 1999; Itzstein et al. 2011). They are involved in the functions of some cell adhesion molecules, including cadherins, protocadherins, and integrins (Watanabe et al. 2009). Within the region associated with head length, for example, eight candidate genes on LG9 were found with functions related to head formation (Figure S3 and Table 2). One small GTPase gene and five genes with known functions highly related to small GTPase were identified in the region on LG9, including ras-related protein rab-33a (rab33a), rap guanine nucleotide exchange factor 2 (rapgef2) (Quilliam et al. 2002), fibroblast growth factor-binding protein-1 (fgfbp1) and -2a (fgfbp2a) (Szebenyi and Fallon 1998), sphingomyelin phosphodiesterase 3 (smpd3) (Aubin et al. 2005; Tomiuk et al. 1998), and septin-7 (sept7) (Cao et al. 2007; Longtine and Bi 2003) (Figure S3). Apart from these genes, the other candidate genes within the associated region are involved in the BMP pathway, which is related to small GTPase. Follistatin-related protein (FSTL) could bind actin and BMP, which is important in cartilage and bone development (Sidis et al. 2002). Transmembrane anterior posterior transformation 1 (Tapt1), regulated by BMP (McPherron et al. 1999), is speculated to be related to axial skeletal patterning during development (Howell et al. 2007). Within the regions associated with head width on LG9, Rab-9b, sorting nexin 25 (snx25), protocadherin 20 (pcdh20), and actin-binding LIM protein 3 (ablm3) were identified. Sorting nexins are reported to interact with the BMP pathway (Parks et al. 2001). Protocadherins, a subgroup of the cadherin superfamily, could regulate gastrulation via small GTPase (Unterseher et al. 2004). Moreover, on the other associated regions, most of candidate genes are known to be related to small GTPases, implying the importance of small GTPases and the functional relationship of candidate genes (Table 2 and Table 3).
We previously proposed the “functional hubs” within QTL of columnaris resistance (Geng et al. 2015), where related genes in the same or similar pathways are physically together. Here, once again, strong clusters of genes involved in the same pathway were also observed for head shape QTL (Figure 3, Table 2, and Table 3) (Geng et al. 2015; Michalak 2008). Although it is possible that just one causal gene is involved in each of the associated regions, it is also possible, and even likely, that the candidate genes in the functional hubs work together to regulate the involved traits.
Sample populations based on large families are suitable for GWAS of most aquaculture species, because the large number of offspring per spawning in most aquaculture species could ensure enough samples at a low cost. In our study, samples based on nine families were used. Compared with unrelated samples, GWAS based on large families has some advantages in identifying QTL (Ott et al. 2011). First, the lack of recombination between causative variations and associated markers increases the power for detection (Mackay and Powell 2007). However, the tradeoff is that mapping resolution is reduced, which results in the long-extending regions of QTL. To narrow down the regions, local SNP markers could be selected around the identified QTL. Instead of genotyping SNPs on the whole genome, genotyping local SNPs costs less, which allows larger number of samples to be included to detect rare recombination. Thus, fine mapping and cost-effective QTL analysis could be achieved by using a two-step strategy. In order to improve brood stocks in catfish production by MAS, further analysis on local SNPs is required to provide more accurate QTL information based on our preliminary data. Second, the clear pedigree information of family-based population design makes it much easier to control the confounding factor caused by population stratification. Nevertheless, the pitfalls of family-based population should not be ignored. The family or population specification of QTL is one of the major reasons for the variance of phenotype. The limited number of founders in the family-based samples may reduce the power to detect QTL. Including more families in the samples could allow validation, increase mapping resolution, improve statistical power, and avoid false positives.
The high fecundity makes family-based samples feasible and efficient for GWAS in most aquaculture species. However, for samples consisting of large families in aquaculture, the performances of commonly used test methods have not been compared. In our study, two methods, EMMAX and QFAM, were evaluated for family-based samples. EMMAX and QFAM are both effective in correcting population stratification. Population stratification is the major confounding factor causing false positive results. If the population stratification is not corrected, false positive results that are associated with population structure rather than the trait of interest could be detected. QFAM is just applicable for family-based population to control population stratification. QFAM partitions the genotypes into between- and within- family components (Fulker et al. 1999; Abecasis et al. 2000). The within-family components could control stratification, and the true association results could be identified without the effect from stratification. Unlike QFAM, EMMAX calculates a pairwise relatedness matrix according to high-density markers to represent the sample structure at first. Then, EMMAX can estimate the contribution of the sample structure to the phenotype and detect associations without confounding effects generated from sample structure (Kang et al. 2010). EMMAX has been proven to be widely applicable for correcting family structure, as well as population structure and cryptic relatedness (Price et al. 2010). However, it has been shown that inclusion of the candidate markers to calculate the pairwise relatedness matrix could lead to loss in power because of double-fitting of the candidate markers in the model (Yang et al. 2014). In our study, EMMAX has less power compared with QFAM. Due to the relatively low power of EMMAX, we concluded that, in terms of statistical power, QFAM performs better than EMMAX with large families in our study.
Our long-term goal is to enhance catfish stocks with a favorable phenotype for head shape, incorporate this trait along with other traits such as disease resistance, and finally support a sustainable and profitable aquaculture industry. Parental fish with homozygous favorable alleles can be screened, making them immediately applicable to the catfish industry. To reach this long-term goal, the genetic basis underlying such traits must be understood, especially the accurate location of QTL controlling the traits of interest. Detailed QTL information will then be used to improve brood stocks by MAS, or introgression of valuable disease resistance alleles from both channel catfish and blue catfish. In our study, GWAS could locate part of associated QTL into several Mb, so fine mapping of QTL is still needed.
Conclusion
This study investigated the genetic basis of head size of catfish backcross fingerlings. Several QTL were identified to be associated with head length and head width. Many genes related to bone development were identified within these associated regions in catfish. Homologs of several candidate genes are involved in skull morphology in various other species ranging from amphibian to mammalian species.
Acknowledgments
The authors thank Ludmilla Kaltenboeck and Huseyin Kucuktas for technical assistance. This project was supported by Agriculture and Food Research Initiative Competitive grant no. 2015-67015-22975 from the USDA (US Department of Agriculture) National Institute of Food and Agriculture (NIFA) and partially supported by USDA Aquaculture Research Program Competitive grant no. 2014-70007-22395. X.G. was supported by scholarships from the China Scholarship Council. The authors declare that they have no competing interests.
Author contributions: X.G. prepared the samples, conducted the statistical analysis and prepared the manuscript. D.Z., P.Z., J.S., and S.L. provided assistance for statistical analysis and manuscript preparation. S.L., J.Y., L.B., J.Z., C.L., and R.W. were involved in fish culture, sample collection, and revising the manuscript. Z.L. supervised the entire study and provided assistance for manuscript preparation. All authors read and approved the final manuscript.
Footnotes
Supplemental material is available online at www.g3journal.org/lookup/suppl/doi:10.1534/g3.116.032201/-/DC1.
Communicating editor: R. Houston
Literature Cited
Dunham, R. A., and R. O. Smitherman, 1984 Ancestry and breeding of catfish in the United States. Alabama Agricultural Experiment Station, Auburn, AL.
