


Abstract
Aedes aegypti is one of the most studied mosquito species, and the principal vector of several arboviruses pathogenic to humans. Recently failure to oviposit, low fecundity, and poor egg-to-adult survival were observed when Ae. aegypti from Senegal (SenAae) West Africa were crossed with Ae. aegypti (Aaa) from outside of Africa, and in SenAae intercrosses. Fluorescent in situ hybridization analyses indicated rearrangements on chromosome 1, and pericentric inversions on chromosomes 2 and 3. Herein, high throughput sequencing (HTS) of exon-enriched libraries was used to compare chromosome-wide genetic diversity among Aaa collections from rural Thailand and Mexico, a sylvatic collection from southeastern Senegal (PK10), and an urban collection from western Senegal (Kaolack). Sex-specific polymorphisms were analyzed in Thailand and PK10 to assess genetic differences between sexes. Expected heterozygosity was greatest in SenAae. FST distributions of 15,735 genes among all six pairwise comparisons of the four collections indicated that Mexican and Thailand collections are genetically similar, while FST distributions between PK10 and Kaolack were distinct. All four comparisons of SenAae with Aaa indicated extreme differentiation. FST was uniform between sexes across all chromosomes in Thailand, but were different, especially on the sex autosome 1, in PK10. These patterns correlate with the reproductive isolation noted earlier. We hypothesize that cryptic Ae. aegypti taxa may exist in West Africa, and the large genic differences between Aaa and SenAae detected in the present study have accumulated over a long period following the evolution of chromosome rearrangements in allopatric populations that subsequently cause reproductive isolation when these populations became sympatric.
The mosquito, Aedes aegypti (L), is the principal vector in tropical and subtropical regions world-wide of dengue (DENV1–4)(Guzman and Harris 2015), Yellow Fever (YF) (Beasley et al. 2015) and Zika (Li et al. 2012) flaviviruses, and of the Chikungunya alphavirus (Lo Presti et al. 2016). The ecology and population biology of the species is well understood (Mattingly 1957), and the ease of colonization and laboratory manipulation have helped it to become the most studied of all mosquito species. There are two recognized subspecies of Ae. aegypti: Ae. aegypti (Aaa) is a domestic form that has spread circumglobally between 35° north and south latitudes, typically in close association with humans, while Ae. aegypti formosus (Aaf) is a sylvan mosquito that occurs primarily in forest habitats. Most studies of these subspecies have occurred in East Africa, where the subspecies are sympatric. McClelland (1974) formally defined Aaf populations as having a dark black cuticle, no pale scales on the first abdominal tergite, breeding in natural containers such as tree holes, and feeding primarily on wild animals. In contrast, Aaa is a more domestic subspecies that has spread out of Africa. Aaa breeds in artificial containers provided by humans, will breed indoors, and has a preference for feeding on human blood. It is described as being a lighter colored mosquito, with a range of pale scaling on the abdominal tergites. Presumably, Aaa arose from ancestral Aaf, and eventually became adapted to human habitats. It then spread from Africa to many different tropical and subtropical regions of the world through human commerce and exploration (Tabachnick 1991).
Detailed mark-release-recapture studies in Kenya (Trpis and Hausermann 1975) demonstrated that immature mosquitoes collected from sylvan, peridomestic, or domestic breeding containers showed an overwhelming preference for their respective habitat as adults. Laboratory experiments crossing Aaa and Aaf from Kenya showed no evidence of assortative mating between the two subspecies (Moore 1979), and found no decrease in fecundity in hybrids, nor any morphological defects. In rural Kenya, Aaf collected from the forest had very different allozyme frequencies when compared to Aaa collected indoors, although some populations used in the study were laboratory colonies several generations from the field (Scott and McClelland 1975). Another study in Kenya showed that Aaa populations within villages are panmictic, but genetically differentiated from Aaa in other villages, even those <2 km away. This suggested that gene flow between villages is infrequent, and Aaf living in the intervening forest do not serve as a “genetic bridge,” so that Aaf and Aaa represent separate breeding populations (Tabachnick and Powell 1978). Further investigation demonstrated that Aaf collected from the forest or disturbed areas around villages (e.g., coconut groves) were genetically distinct from Aaa collections made indoors (Tabachnick et al. 1979).
In contrast, Ae. aegypti in West Africa has received relatively little attention. While scale patterns correlate with genetic differences in East Africa (Tabachnick et al. 1979), this is not the case in West Africa (Huber et al. 2008; Moore et al. 2013; Paupy et al. 2008, 2010; Sylla et al. 2009), where cuticle color is predominantly black, with a continuum of scaling patterns. Collections from West Africa with varied scale patterns have been sampled in both the dry and rainy seasons from different vegetation zones, and from domestic vs. sylvan habitats. Regardless of collection site, most variation was associated with geographic distance, vegetative zones, ecological habitats, and season, rather than marker type or scale pattern (Brown et al. 2014, 2011; Huber et al. 2008; Paupy et al. 2008; Sylla et al. 2009). Accordingly, we designated Ae. aegypti in West Africa as SenAae because cuticle color is predominantly black (therefore not Aaa), and mosquitoes collected in both sylvatic and urban sites exhibit a continuum of scaling patterns (therefore not Aaf).
In an attempt to clarify genetic relationships among, and within, West African Ae. aegypti, we recently reported crossing experiments of Aaa P1 laboratory strains with Senegal Ae. aegypti (SenAae) (Dickson et al. 2016), wherein we were unable to build intercross families due to poor F1 oviposition and low F2 egg-to-adult survival. Egg hatch was predicted based upon Haldane’s rule (Haldane 1922) to be low when a female mates with a hybrid F1 male, but average when a male mates with a hybrid F1 female. Instead, most females mated to hybrid males laid no eggs, and egg-pupal survival was reduced when males mated with hybrid females. Linkage and fluorescent in situ hybridization (FISH) analyses identified a likely rearrangement on chromosome 1, and identified two rDNA cistrons on that chromosome, and pericentric inversions on chromosomes 2 and 3 (Dickson et al. 2016). The latter results suggest that the reproductive isolation observed within SenAae may be associated with chromosome rearrangements. These observations differ markedly from the 1979 study of hybridization and mating behavior between Aaa and Aaf in East Africa, which found no evidence of hybrid breakdown or of assortative mating (Moore 1979). The goal of the current study was to use high throughput sequencing (HTS) of exon-enriched gDNA libraries to assess the degree of genetic differentiation between two interfertile SenAae (called PK10 and Kaolack), and two interfertile Aaa (Thailand and Mexico) collections. Dual replicate pools of equal numbers of males and females were used for these comparisons. Expected heterozygosity (Hexp) in each collection was compared to give an indication of the relative levels of within-collection genetic diversity. These analyses were extended by assessing sex-specific polymorphisms for the Thailand (Aaa) and PK10 (SenAae) collections. Standardized variance in SNP frequencies (FST) was compared within and between Aaa and SenAae, and between females and males in the Thailand (Aaa) and PK10 (SenAae) collections. SNP frequencies were significantly different among sexes in PK10, with the largest differences occurring on sex chromosome 1, but were homogeneous across all chromosomes in the Thailand collection.
Materials and Methods
Mosquito collections
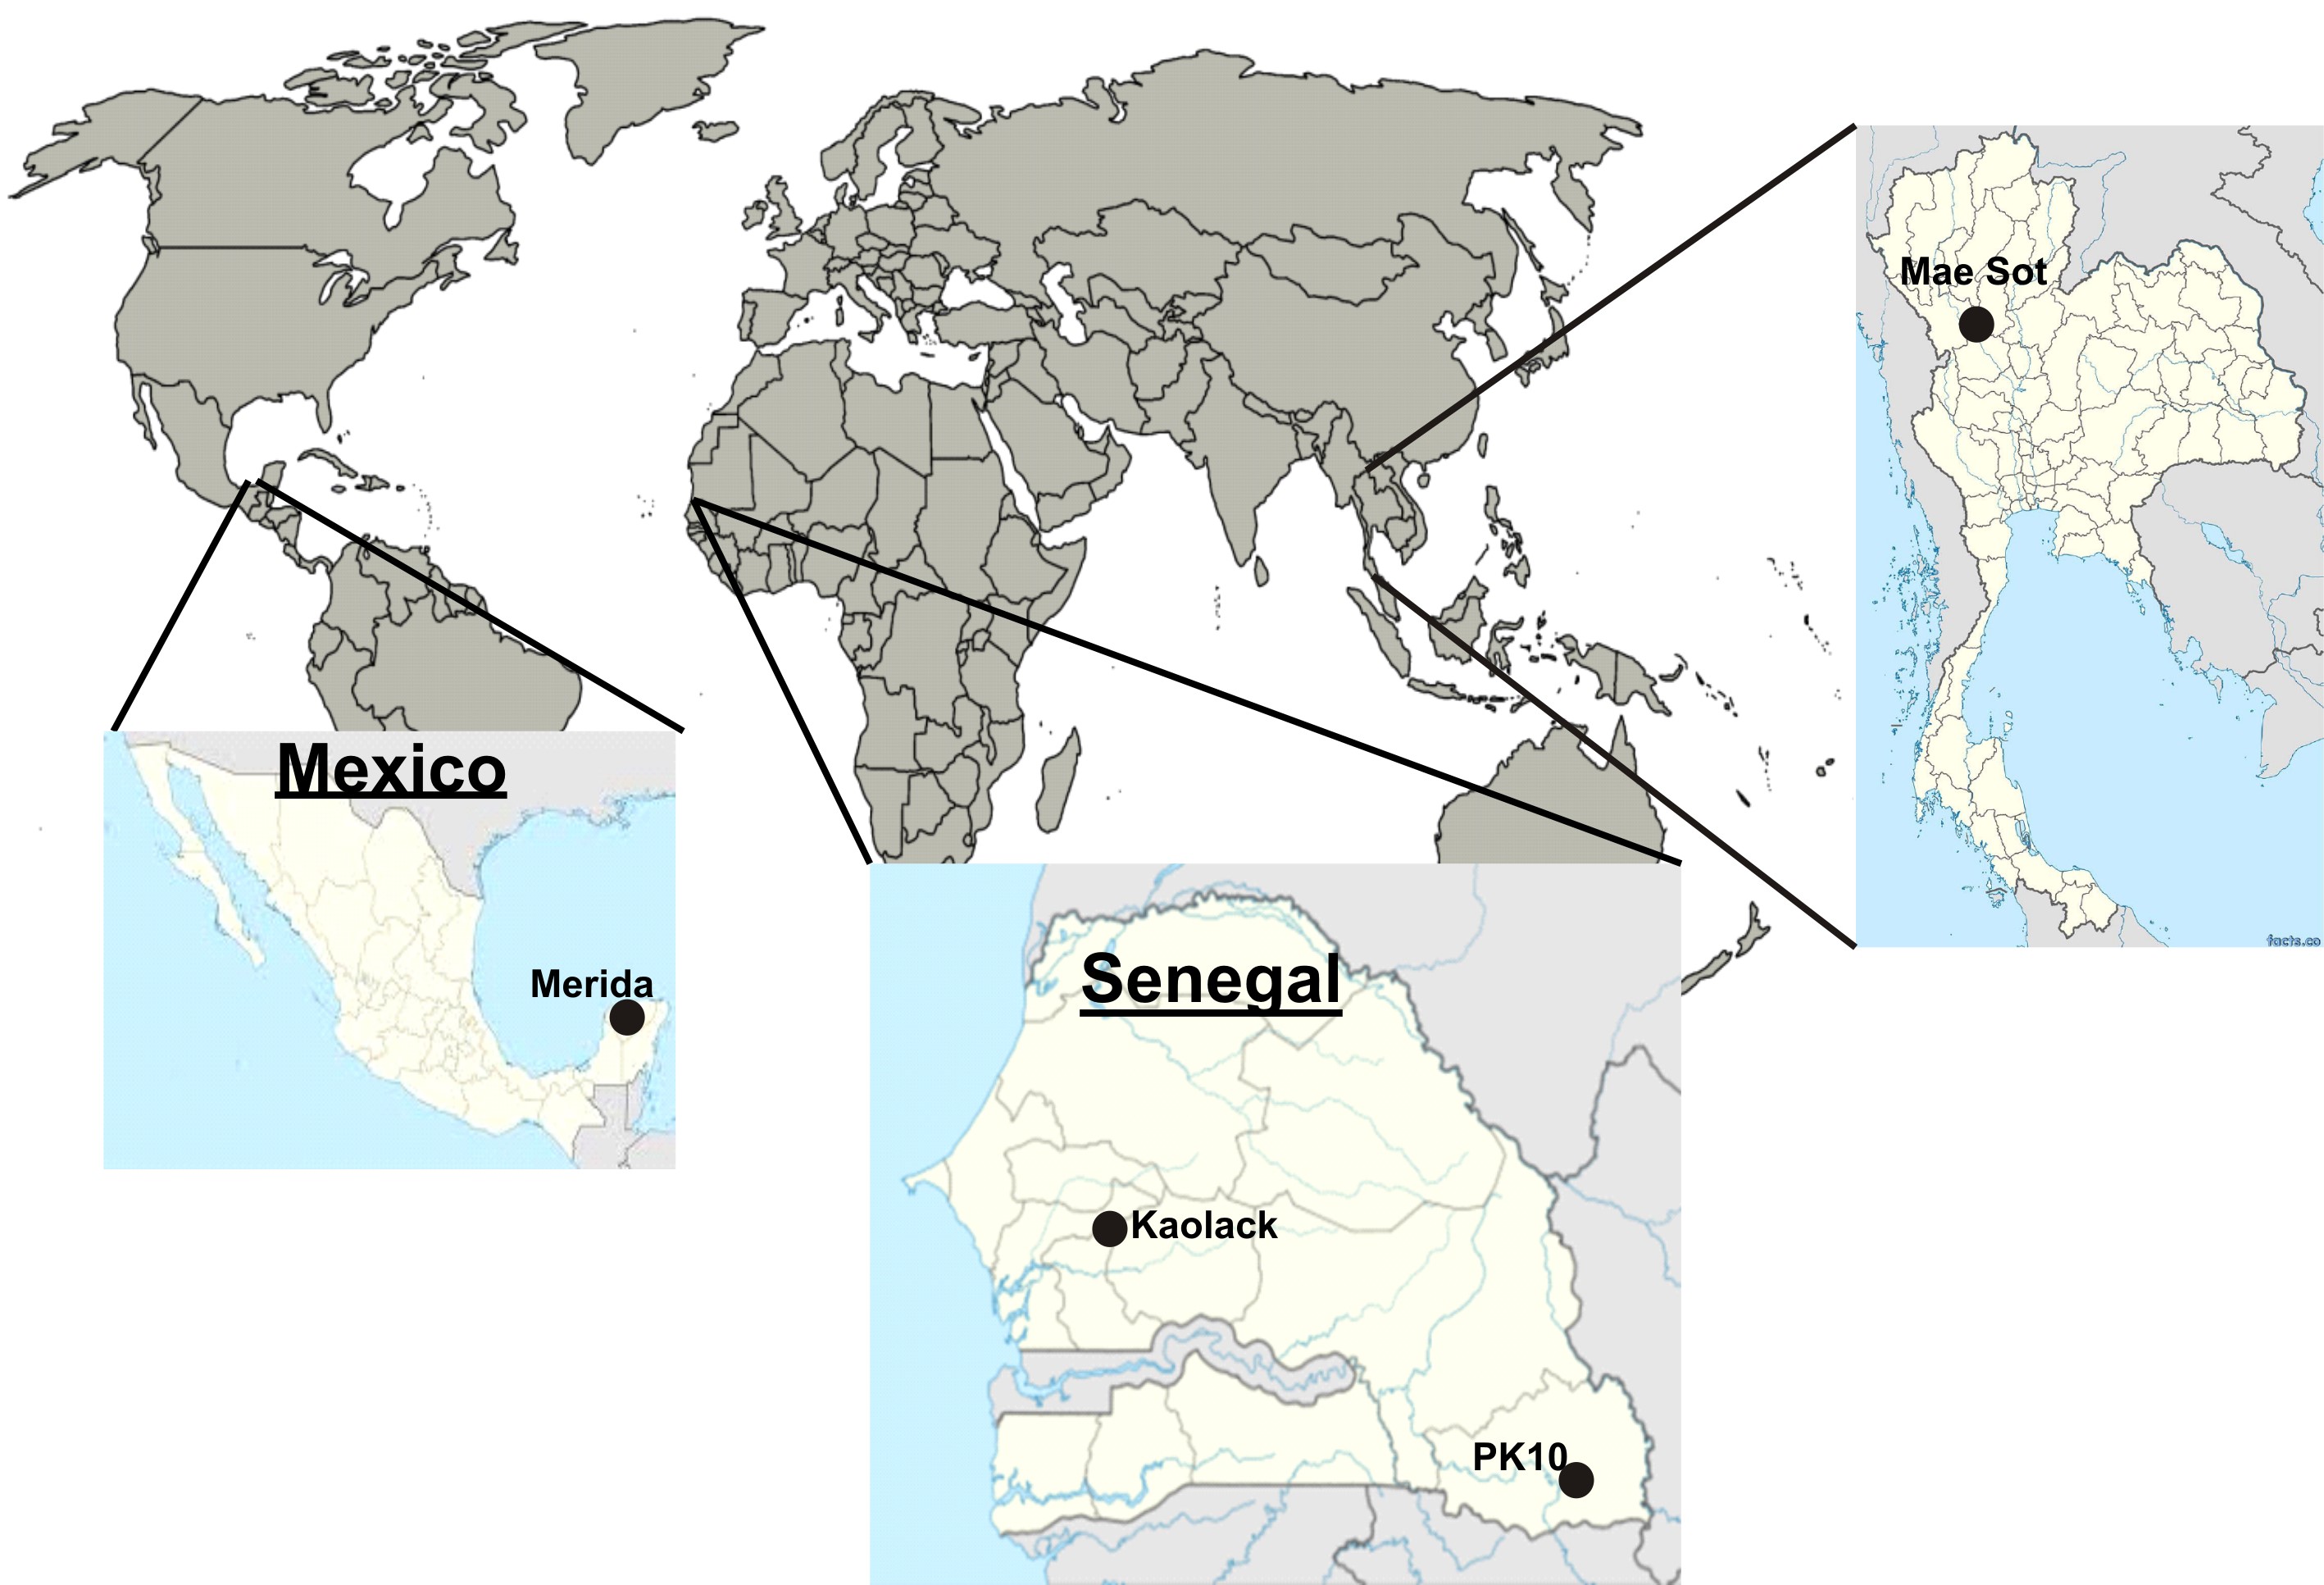
Senegalese Ae. aegypti populations were collected as larvae near domestic sites in urban and village environments, as well as from sylvatic habitats throughout Senegal (Sylla et al. 2009) (Supplemental Material, Figure S1). In February 2010, Ae. aegypti were collected in Kaolack (14°9′22.35′′N, 16°4′32.31′′W) in West Central Senegal, and in the PK10 forest (12°36′43.00′′N, 12°14′46.80′′W) in southeastern Senegal in September 2011. A complete description of mosquitoes found in PK10 has been published (Sylla et al. 2013). The PK10 colony was established from larvae taken from treeholes at the forest–savannah margin (Sylla et al. 2013). Both 2009 and 2011 PK10 collections consisted of adults without scales on the first abdominal tergite (McClelland 1974). The Merida, Mexico (Vergel) (20°57′16.82′′N, 89°35′20.24′′W) collection of Aaa was collected in 2007. The Pai Lom, Mae Sot Thailand (16°42′46.54′′N, 98°34′28.74′′E) 2002 collection of Aaa consisted of DNA individually isolated from adults (Bosio et al. 2005). Sex-specific polymorphisms were analyzed in PK10 (SenAae) and Thailand (Aaa), but not in Mexico (Aaa) or Kaolack (SenAae) collections because mosquitoes were not identified to sex prior to DNA isolation.
Larvae were removed mostly from artificial containers (e.g., tires, water storage containers, and discarded trash), reared to adults, blood fed on the senior author’s arm, and collected eggs were returned to Fort Collins where they were established as laboratory colonies. In each collection, these were raised to adults, transferred to 1-pint cages, anesthetized with Triethylamine (FlyNap Carolina Biological Supply Company, Burlington, NC), and classified according to the presence/absence of scales on the first abdominal tergite (McClelland 1974; Sylla et al. 2009, 2013). At least 50 adults of each sex were individually identified and stored in Purell Advanced Hand Sanitizer for eventual extraction of DNA (Black and DuTeau 1997). All colonized adults were maintained at 28°, 70–80% relative humidity, and for a 12:12 hr photoperiod.
Sequencing
HTS of exon-enriched libraries (Juneja et al. 2015) was used to quantify the extent of genomic differences within, and among, the four Ae. aegypti collections analyzed in this study, and between sexes within PK10 (SenAae) and Thailand (Aaa) collections. Twelve libraries were constructed: (1) PK10 males replicate 1 (n =12 mosquitoes), (2) PK10 males replicate 2 (n = 12), (3) PK10 females replicate 1 (n = 12), (4) PK10 females replicate 2 (n = 12), (5) Thailand males replicate 1 (n = 12), (6) Thailand males replicate 2 (n = 12), (7) Thailand females replicate 1, (8) Thailand females replicate 2 (n = 12), (9) Kaolack equal numbers of both sexes replicate 1 (n = 14), (10) Kaolack equal numbers of both sexes replicate 2 (n = 14), (11) Merida, Mexico equal numbers of both sexes replicate 1 (n = 22), and (12) Merida, Mexico equal numbers of both sexes replicate 2 (n = 22). Thus, each of the four collections was represented by 28, 44, or 48 individuals.
Prior to pooling, DNA in individual mosquitoes was quantified using Pico Green (Life Technologies, Thermo Fisher Scientific Inc.), and equal amounts of DNA per mosquito were pooled. A Covaris S2 sonicator (Covaris Ltd, Brighton, U.K.) sheared pooled DNA to an average size of 500 bp. Sonication conditions were: duty cycle 10%, intensity 5.0, cycles per burst 200, duration 40 sec, mode frequency sweeping, displayed power 23 W, and Temperature 5.5°–6°. Each TruSeq DNA LT (v.2) library was prepared using 1 μg of sheared genomic DNA following the manufacturer’s recommendations. Equimolar quantities of prepared libraries were pooled and enriched for coding sequences by exome capture using custom SeqCap EZ Developer probes (Nimblegen) (Juneja et al. 2015). Overlapping probes covering the protein coding sequence (not including UTRs) in the AaegL3.3 gene annotations (https://www.vectorbase.org/organisms/aedes-aegypti/liverpool-lvp/AaegL3.3) were produced by Nimblegen based on exonic coordinates specified by the Jiggins laboratory. In total, 26.7 Mb of the genome (2%) was targeted for enrichment. Exome capture coordinates are available at https://www.jiggins.gen.cam.ac.uk/data/Aaegypti_exome.bed. Enrichment followed the Nimblegen SeqCap EZ protocol. Briefly, pooled TruSeq libraries were hybridized to the probes for 64 hr, unbound DNA was washed away, and the targeted DNA was eluted and amplified. These were then sequenced on two lanes of a HiSeq2000 (Illumina) for paired-end 2 × 100 nt sequencing. TruSeq library preparation, exome capture, and sequencing were performed by the High-Throughput Genomics Group at the Wellcome Trust Centre for Human Genetics (Oxford, UK), and produced reads with quality scores >30.
Alignments and population genetics pipeline
A custom concatenated reference file “All3U” was built based on the Vectorbase AaegL3.3 gene build, and SNPs were called with respect to this build. The reference was used for the detailed analysis of 18,840 transcripts among 15,735 genes. A FORTRAN program used the coordinates of the features of each gene appearing in Aedes-aegypti Liverpool_ BASEFEATURES_Aaegl3.3.GTF to extract: (1) 600 bp of the cis region 5′ to each annotated transcript (5′ nontranscribed = 5′NTR), (2) all 5′UTRs, (3) exons, (4) introns, (5) 3′UTRs, and (6) a 600 bp cis region in the 3′ direction (3′ nontranscribed = 3′NTR). Each SNP was given an ordered SNPID number according to its position in the gene, the location of the gene in the supercontig, and where the supercontig mapped physically (Timoshevskiy et al. 2014). There were 1948 mapped genes containing 41,119,004 SNPs on chromosome 1, 3429 genes containing 70,643,307 SNPs on chromosome 2, and 2382 genes with 44,883,168 SNPs on chromosome 3. There were 7862 unmapped genes containing 144,703,188 SNPs. In total there were 15,735 genes containing 301,348,667 SNPs.
Fastq files from each library were aligned to the All3U reference file using GSNAP (v. 2013-10-28), allowing 10% divergence from the reference (Wu and Nacu 2010). SAMtools (Li et al. 2009) converted GSNAP outputs to *.mpileup files. The “readcounts” command in Varscan2 (v2.3.5) (Koboldt et al. 2012) used the *.mpileup file to report SNPs, with default values of a minimum of 15× coverage in each library, and a minimum base quality of 30 (http://varscan.sourceforge.net/using-varscan.html). A series of FORTRAN programs then read the “readcount” files to produce a flat file containing the SNPID number, the Aaegl3.3 reference nucleotide, its coverage at each sequenced position, and the coverages of insertions or deletions at that position.
The program “Trim” removed all SNPs that had <15 counts, and capped all SNP coverage at 2000 to avoid regions of repetitive DNA. The program “2 × 2” read two files, one from each replicate at a collection site, and produced a single “2 × 2.out” file that contained SNPs that occurred in both replicate datasets for each collection (Mexico, Thailand male, Thailand female, PK10 male, PK10 female, and Kaolack). A program “2 × 2 × 2” then read two 2 × 2.out files to produce a list of SNPs common to a pair of collections. A program “Tables” then read the two “2 × 2.out” files and the list to produce a contingency table for each SNP common to both collections. The contingency file contained: (1) the SNPID coordinate followed by four lines containing (2) the name of the library containing that SNP, and (3) the coverage for each nucleotide at that SNP. To ensure high confidence SNP calls, replicate SNP frequencies were compared using a heterogeneity χ2 test with nid-1 degrees of freedom, where nid is the number of nucleotides and indels segregating at a SNP. Any SNP in which nucleotide frequencies were significantly different between either replicate were discarded. A program read the contingency table file to produce a file that contains for each SNP: (1) the SNPID, (2) the VectorBase Gene ID (e.g., AAEL001234), (3) coverages of all nucleotide/indels in the first collection, (4) coverages of all nucleotide/indels in the second collection, (5) numbers of alternate nucleotides at that SNP, (6) a list of polymorphic nucleotides/indels, (7) the Aaegl3.3 reference nucleotide, (8) the alternate nucleotide (second most common nucleotide, also referred to as the minor allele), (9) mutation type (i.e., “transition,” “transversion,” “insertion,” or “deletion”), (10) whether the mutation is a synonymous or a replacement substitution for SNPs in codons, and (11) whether the SNP resides in a first, second, or third codon position, or occurs within a 5′UTR, 5′NTR, 3′UTR, 3′NTR, or an intron. Transfer RNAs were annotated using the anticodon tool at http://lowelab.ucsc.edu/tRNAscan-SE/ (Schattner et al. 2005).
Data availability
All fastq files are available through the NCBI Sequence Read Archive (https://www.ncbi.nlm.nih.gov/sra) under accession numbers PRJNA258086 and SRP061709.
Results
Genetic diversity within Ae. aegypti collections
Numbers of sequences in each of the six libraries appear in Table 1. To estimate the amount of genetic diversity within each collection, the percentage of polymorphic SNPs were calculated. The greatest percentage of polymorphism was observed in the PK10 (8.3%) and Kaolack (7.3%) collections. Figure 1A shows the distribution of Hexp in all four collections. The distribution of Hexp was shifted to the right in PK10 and Kaolack collections, whereas the Hexp distributions for the two Aaa collections were skewed toward lower values. Figure 1B shows the LOD scores associated with three heterogeneity χ2 analyses. Minor differences in Hexp distributions exist between Mexico and Thailand (green line), or between Kaolack and PK10 (black line). However, the differences in Hexp distributions between Aaa and SenAae were large and highly significant (red line).
Numbers of monomorphic sites in a in the Ae. aegypti collection followed by the numbers of alternate nucleotides at polymorphic sites
| Number of Nucleotides/Indels | ||||||||
|---|---|---|---|---|---|---|---|---|
| Collection | Monomorphic | 2 | 3 | 4 | 5 | 6 | Total | % Polymorphic |
| PK10 | 30,229,087 | 2,580,103 | 148,547 | 9276 | 379 | 12 | 32,967,403 | 8.31% |
| Female | 28,164,602 | 1,949,160 | 83,760 | 3976 | 131 | 6 | 30,201,634 | 6.74% |
| Male | 28,324,103 | 1,988,143 | 90,424 | 4624 | 174 | 5 | 30,407,471 | 6.85% |
| Kaolack | 30,259,280 | 2,250,995 | 121,064 | 7291 | 305 | 9 | 32,638,942 | 7.29% |
| Merida | 28,592,543 | 1,459,996 | 42,017 | 1418 | 48 | 1 | 30,096,023 | 5.00% |
| Thailand | 30,224,052 | 1,754,936 | 54,368 | 2035 | 72 | 2 | 32,035,463 | 5.65% |
| Female | 26,580,423 | 1,119,509 | 25,775 | 816 | 30 | 1 | 27,726,553 | 4.13% |
| Male | 27,166,304 | 1,222,100 | 30,373 | 979 | 35 | 0 | 28,419,790 | 4.41% |
For example, 32,967,403 sites were analyzed in PK10. Of these, 30,229,087 of these were monomorphic, while 2,580,103 sites had two alternative nucleotides/indels, and 148,547 had three alternative nucleotides/indels. The percentage polymorphic is 100×[1 − (monomorphic/total)].
| Number of Nucleotides/Indels | ||||||||
|---|---|---|---|---|---|---|---|---|
| Collection | Monomorphic | 2 | 3 | 4 | 5 | 6 | Total | % Polymorphic |
| PK10 | 30,229,087 | 2,580,103 | 148,547 | 9276 | 379 | 12 | 32,967,403 | 8.31% |
| Female | 28,164,602 | 1,949,160 | 83,760 | 3976 | 131 | 6 | 30,201,634 | 6.74% |
| Male | 28,324,103 | 1,988,143 | 90,424 | 4624 | 174 | 5 | 30,407,471 | 6.85% |
| Kaolack | 30,259,280 | 2,250,995 | 121,064 | 7291 | 305 | 9 | 32,638,942 | 7.29% |
| Merida | 28,592,543 | 1,459,996 | 42,017 | 1418 | 48 | 1 | 30,096,023 | 5.00% |
| Thailand | 30,224,052 | 1,754,936 | 54,368 | 2035 | 72 | 2 | 32,035,463 | 5.65% |
| Female | 26,580,423 | 1,119,509 | 25,775 | 816 | 30 | 1 | 27,726,553 | 4.13% |
| Male | 27,166,304 | 1,222,100 | 30,373 | 979 | 35 | 0 | 28,419,790 | 4.41% |
For example, 32,967,403 sites were analyzed in PK10. Of these, 30,229,087 of these were monomorphic, while 2,580,103 sites had two alternative nucleotides/indels, and 148,547 had three alternative nucleotides/indels. The percentage polymorphic is 100×[1 − (monomorphic/total)].
Expected heterozygosity (Hexp) distribution for each collection. (A) Aaa Mexico (red line), Aaa Thailand (bright blue), SenAae PK-10 (black), and SenAae Kaolack (green). (B) Hexp distributions were compared with one another using a heterogeneity χ2 test of the number of genes in each 0.01 bin along the abscissa in the histogram. Aaavs.SenAae comparisons (red line) have larger LOD differences in Hexp scores than Aaavs.Aaa (green line) or SenAaevs.SenAae (black line).
Table 2 shows a gene-wise comparison of Hexp in all six pairwise comparisons of collections, and between sexes, in PK10 and Thailand. Hexp in Mexico was greater that Hexp in Thailand at 67% of SNPs. Hexp in PK10 was greater than Hexp in the three other collections in 86–96% of SNPs. Interestingly, Hexp in Kaolack was less than Hexp in Thailand or Mexico.
Expected heterozygosity (Hexp) in Ae. aegypti collections
| Comparison | Number of Genes | Hexp (1) > Hexp(2) | Hexp (1) < Hexp (2) | % Hexp (1) > Hexp (2) (%) | Average Difference | Probability in Pairwise t-Test |
|---|---|---|---|---|---|---|
| (1) Mexico vs. (2) Thailand | 15,735 | 10,628 | 5107 | 68 | 0.0018 | ≤2.2E–16 |
| (1) PK10 vs. (2) Kaolack | 15,735 | 15,211 | 524 | 97 | 0.0082 | ≤2.2E–16 |
| (1) PK10 vs. (2) Mexico | 15,735 | 13,650 | 2085 | 87 | 0.0054 | ≤2.2E–16 |
| (1) PK10 vs. (2) Thailand | 15,735 | 14,340 | 1395 | 91 | 0.0072 | ≤2.2E–16 |
| (1) Kaolack vs. (2) Mexico | 15,735 | 4509 | 11,226 | 29 | 0.0029 | ≤2.2E–16 |
| (1) Kaolack vs. (2) Thailand | 15,735 | 6841 | 8894 | 43 | 0.0010 | ≤2.2E–16 |
| (1) PK10 female vs. (2) male | 15,722 | 8499 | 7223 | 54 | 0.0008 | ≤2.2E–16 |
| (1) Thailand female vs. (2) male | 15,481 | 6910 | 8571 | 45 | −0.0018 | ≤2.2E–16 |
For example, in comparing the Mexican and Thailand collections, 15,735 genes occurred in common between the two collections. In 10,628 of these genes, Hexp was greatest in the Mexican collection, while Hexp was greatest in 5107 genes in Thailand. Hexp was greatest in the Mexican collection in 68% of comparisons, and the average difference in Hexp between Mexican and Thailand collections was 0.0018, which was significantly greater than zero.
| Comparison | Number of Genes | Hexp (1) > Hexp(2) | Hexp (1) < Hexp (2) | % Hexp (1) > Hexp (2) (%) | Average Difference | Probability in Pairwise t-Test |
|---|---|---|---|---|---|---|
| (1) Mexico vs. (2) Thailand | 15,735 | 10,628 | 5107 | 68 | 0.0018 | ≤2.2E–16 |
| (1) PK10 vs. (2) Kaolack | 15,735 | 15,211 | 524 | 97 | 0.0082 | ≤2.2E–16 |
| (1) PK10 vs. (2) Mexico | 15,735 | 13,650 | 2085 | 87 | 0.0054 | ≤2.2E–16 |
| (1) PK10 vs. (2) Thailand | 15,735 | 14,340 | 1395 | 91 | 0.0072 | ≤2.2E–16 |
| (1) Kaolack vs. (2) Mexico | 15,735 | 4509 | 11,226 | 29 | 0.0029 | ≤2.2E–16 |
| (1) Kaolack vs. (2) Thailand | 15,735 | 6841 | 8894 | 43 | 0.0010 | ≤2.2E–16 |
| (1) PK10 female vs. (2) male | 15,722 | 8499 | 7223 | 54 | 0.0008 | ≤2.2E–16 |
| (1) Thailand female vs. (2) male | 15,481 | 6910 | 8571 | 45 | −0.0018 | ≤2.2E–16 |
For example, in comparing the Mexican and Thailand collections, 15,735 genes occurred in common between the two collections. In 10,628 of these genes, Hexp was greatest in the Mexican collection, while Hexp was greatest in 5107 genes in Thailand. Hexp was greatest in the Mexican collection in 68% of comparisons, and the average difference in Hexp between Mexican and Thailand collections was 0.0018, which was significantly greater than zero.
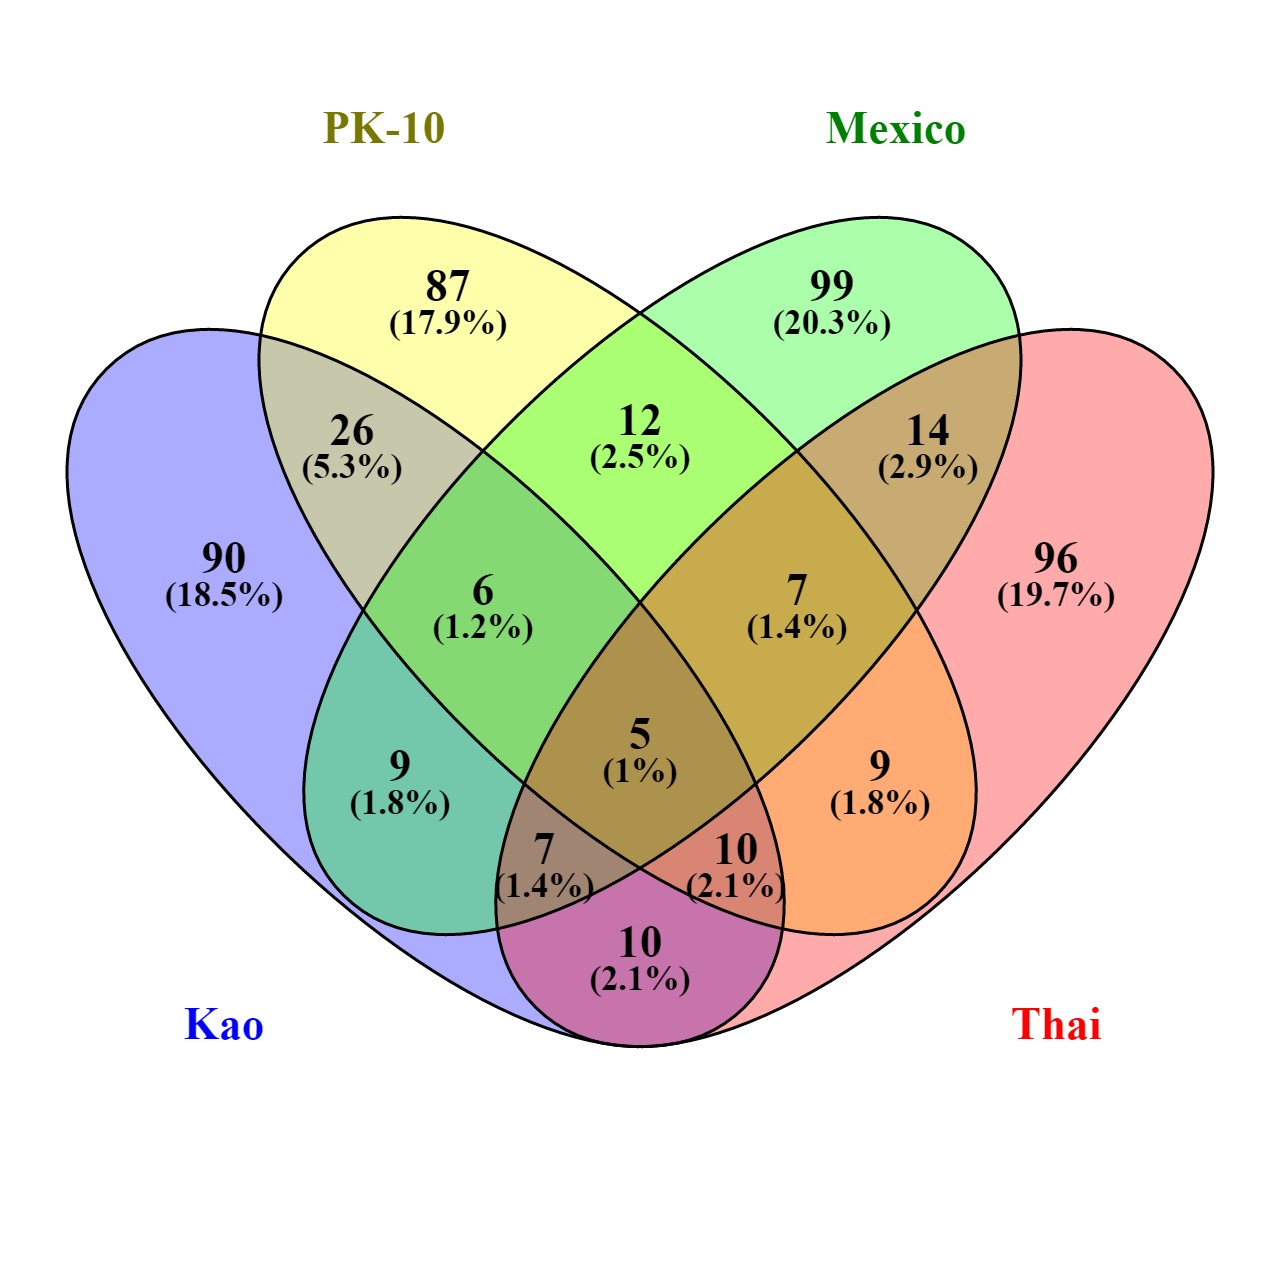
Next, Hexp values were ranked from smallest to largest, and genes with the lowest 1% of average Hexp, and highest 1% of average Hexp were identified. Of a total of 490 genes in the lower 1% tail of the Hexp distributions, 376 occurred in only one collection, 80 occurred in two collections, 29 occurred in three collections, and five genes had low Hexp in all collections (Figure S2 and Table S1). AAEL008073-RA encodes a Hyaluronan/mRNA-binding protein that is known in humans to bind the mRNA of type-1 plasminogen activator inhibitor (PAI-1), and is thought to be involved in regulation of mRNA stability (Heaton et al. 2001). The second gene, AAEL014847-RA, encodes innexin 2 (AAEL014847, inx2), and is involved in postembryonic development in drosophilids (Holcroft et al. 2013). The third is the 28S rDNA gene, while AAEL007163-RA and AAEL014638-RA encode hypothetical proteins.
In the upper 1% (Table S2) (n = 326), 160 genes occurred in only one collection, 63 occurred in two collections, 58 occurred in three collections, while 44 genes were common in all collections (Figure S3). Half (22) coded for noncoding RNAs (ncRNAs), 21 of which were tRNAs, and one was the U2 spliceosomal RNA gene (AAEL017645). Three encode ankyrins—a family of adaptor proteins that help attach integral membrane proteins to the cytoskeleton; they have binding sites for the β-subunit of spectrin, and 12 families of integral membrane proteins. Ankyrins appear to be required to maintain the integrity of plasma membranes, and to anchor specific ion channels, ion exchangers, and ion transporters in the plasma membrane. Two encode mitochondrial membrane ATP synthase (F1F0 ATP synthase or Complex V) that produce ATP from ADP in the presence of a proton gradient across the mitochondrial membrane, and two encode lipid storage droplets surface binding protein 2(lsd2), which is essential for embryogenesis, and required for normal deposition of neutral lipids in the oocyte.
Genetic differences among Ae. aegypti collections
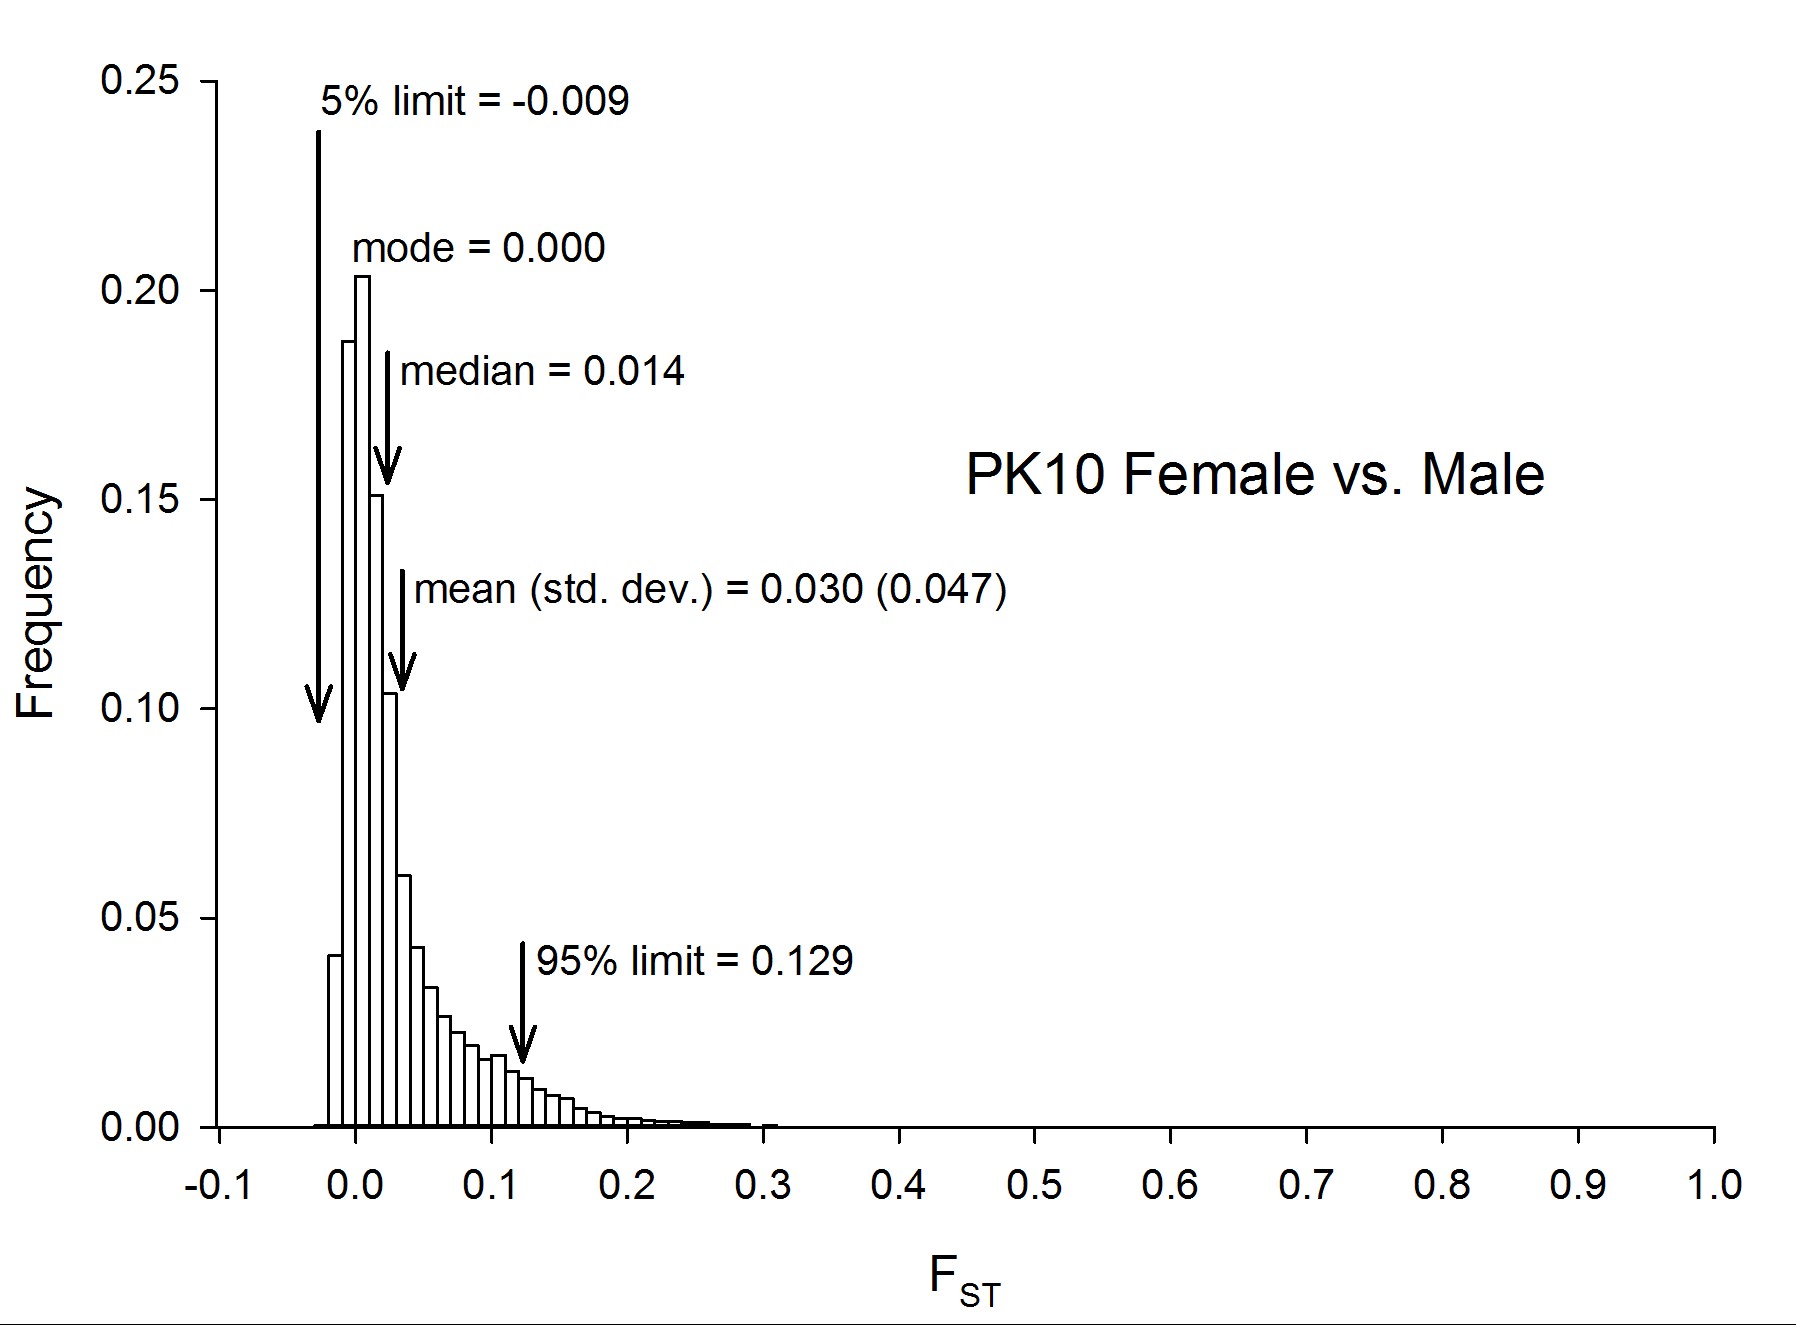
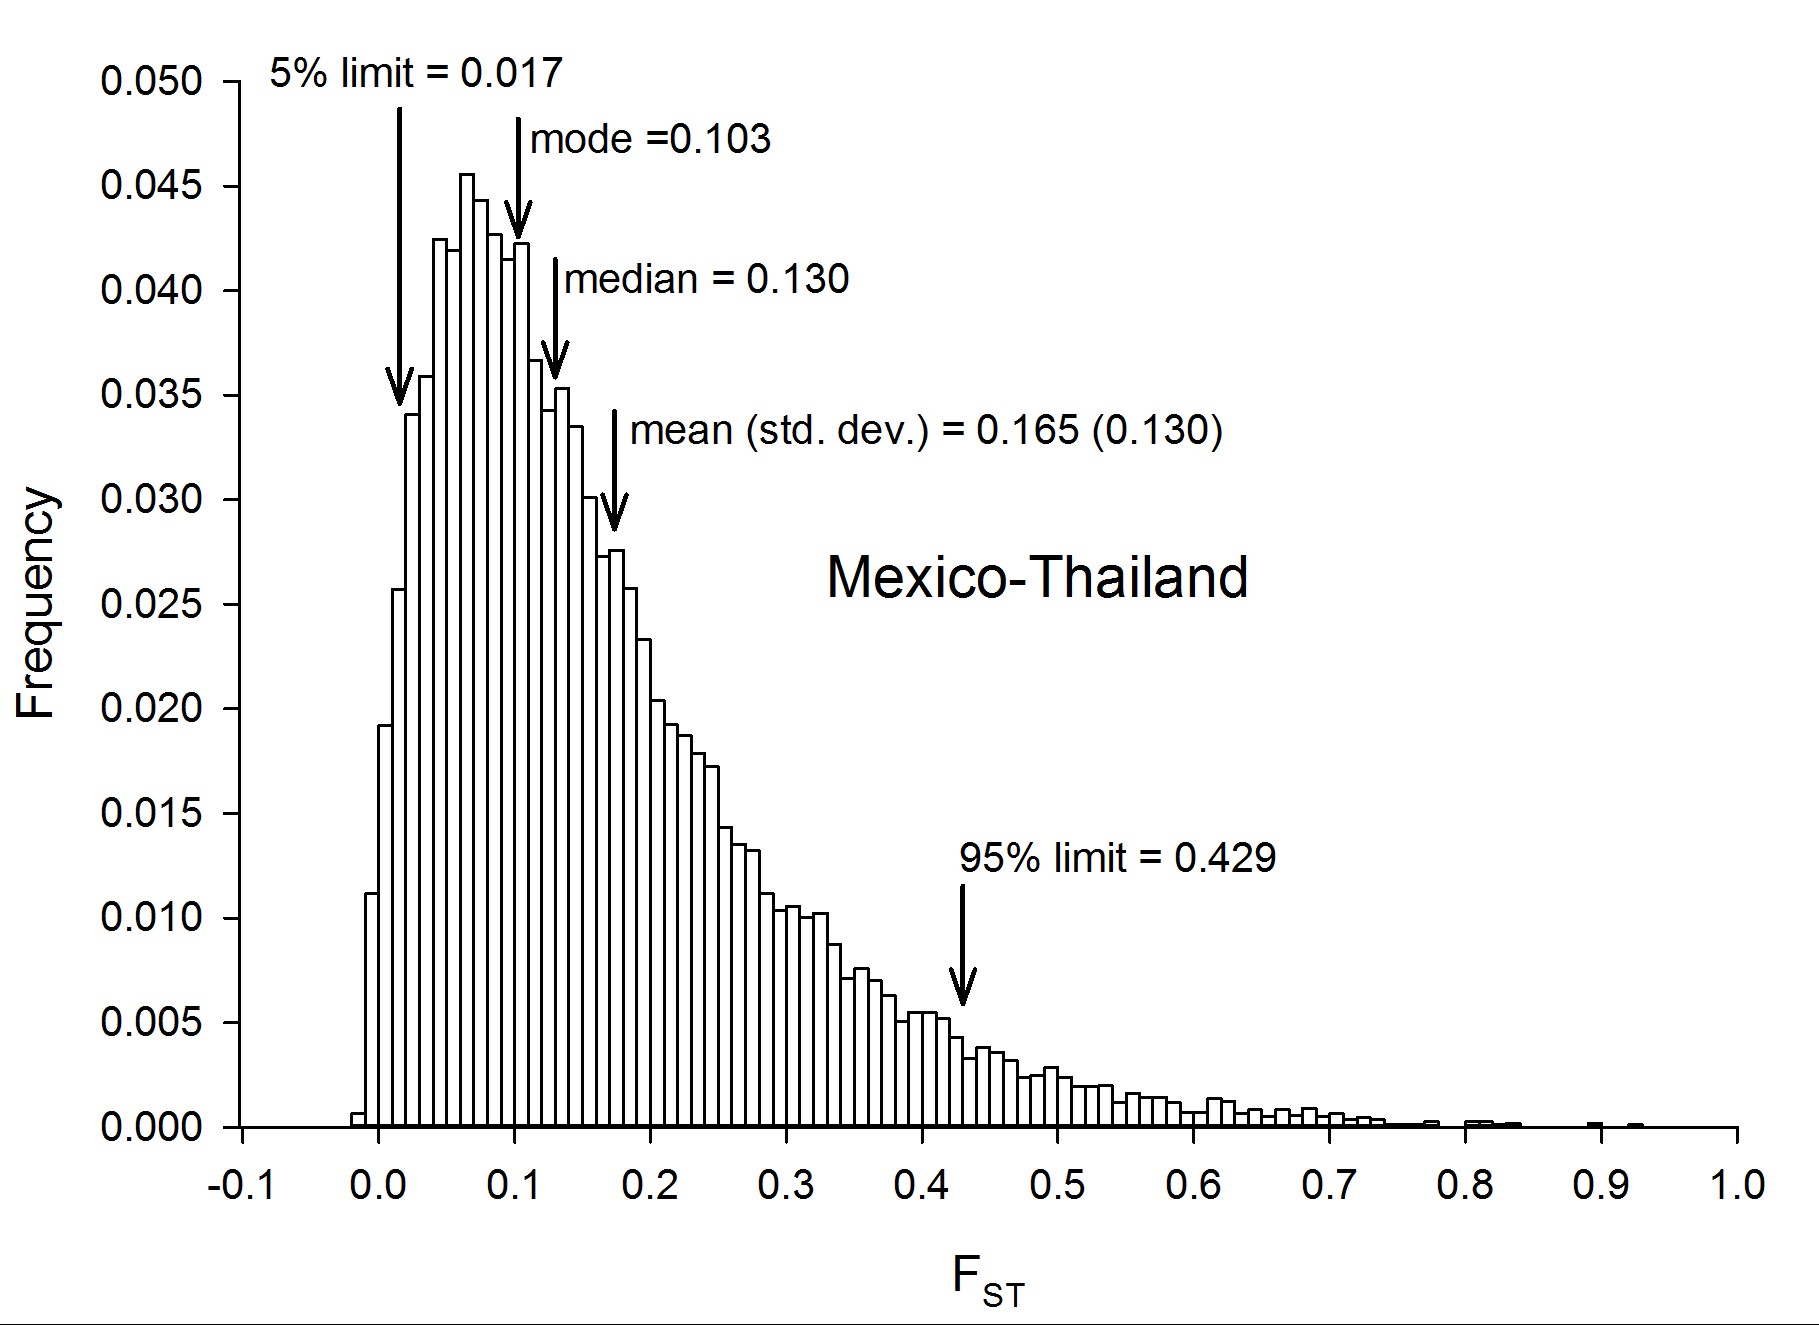
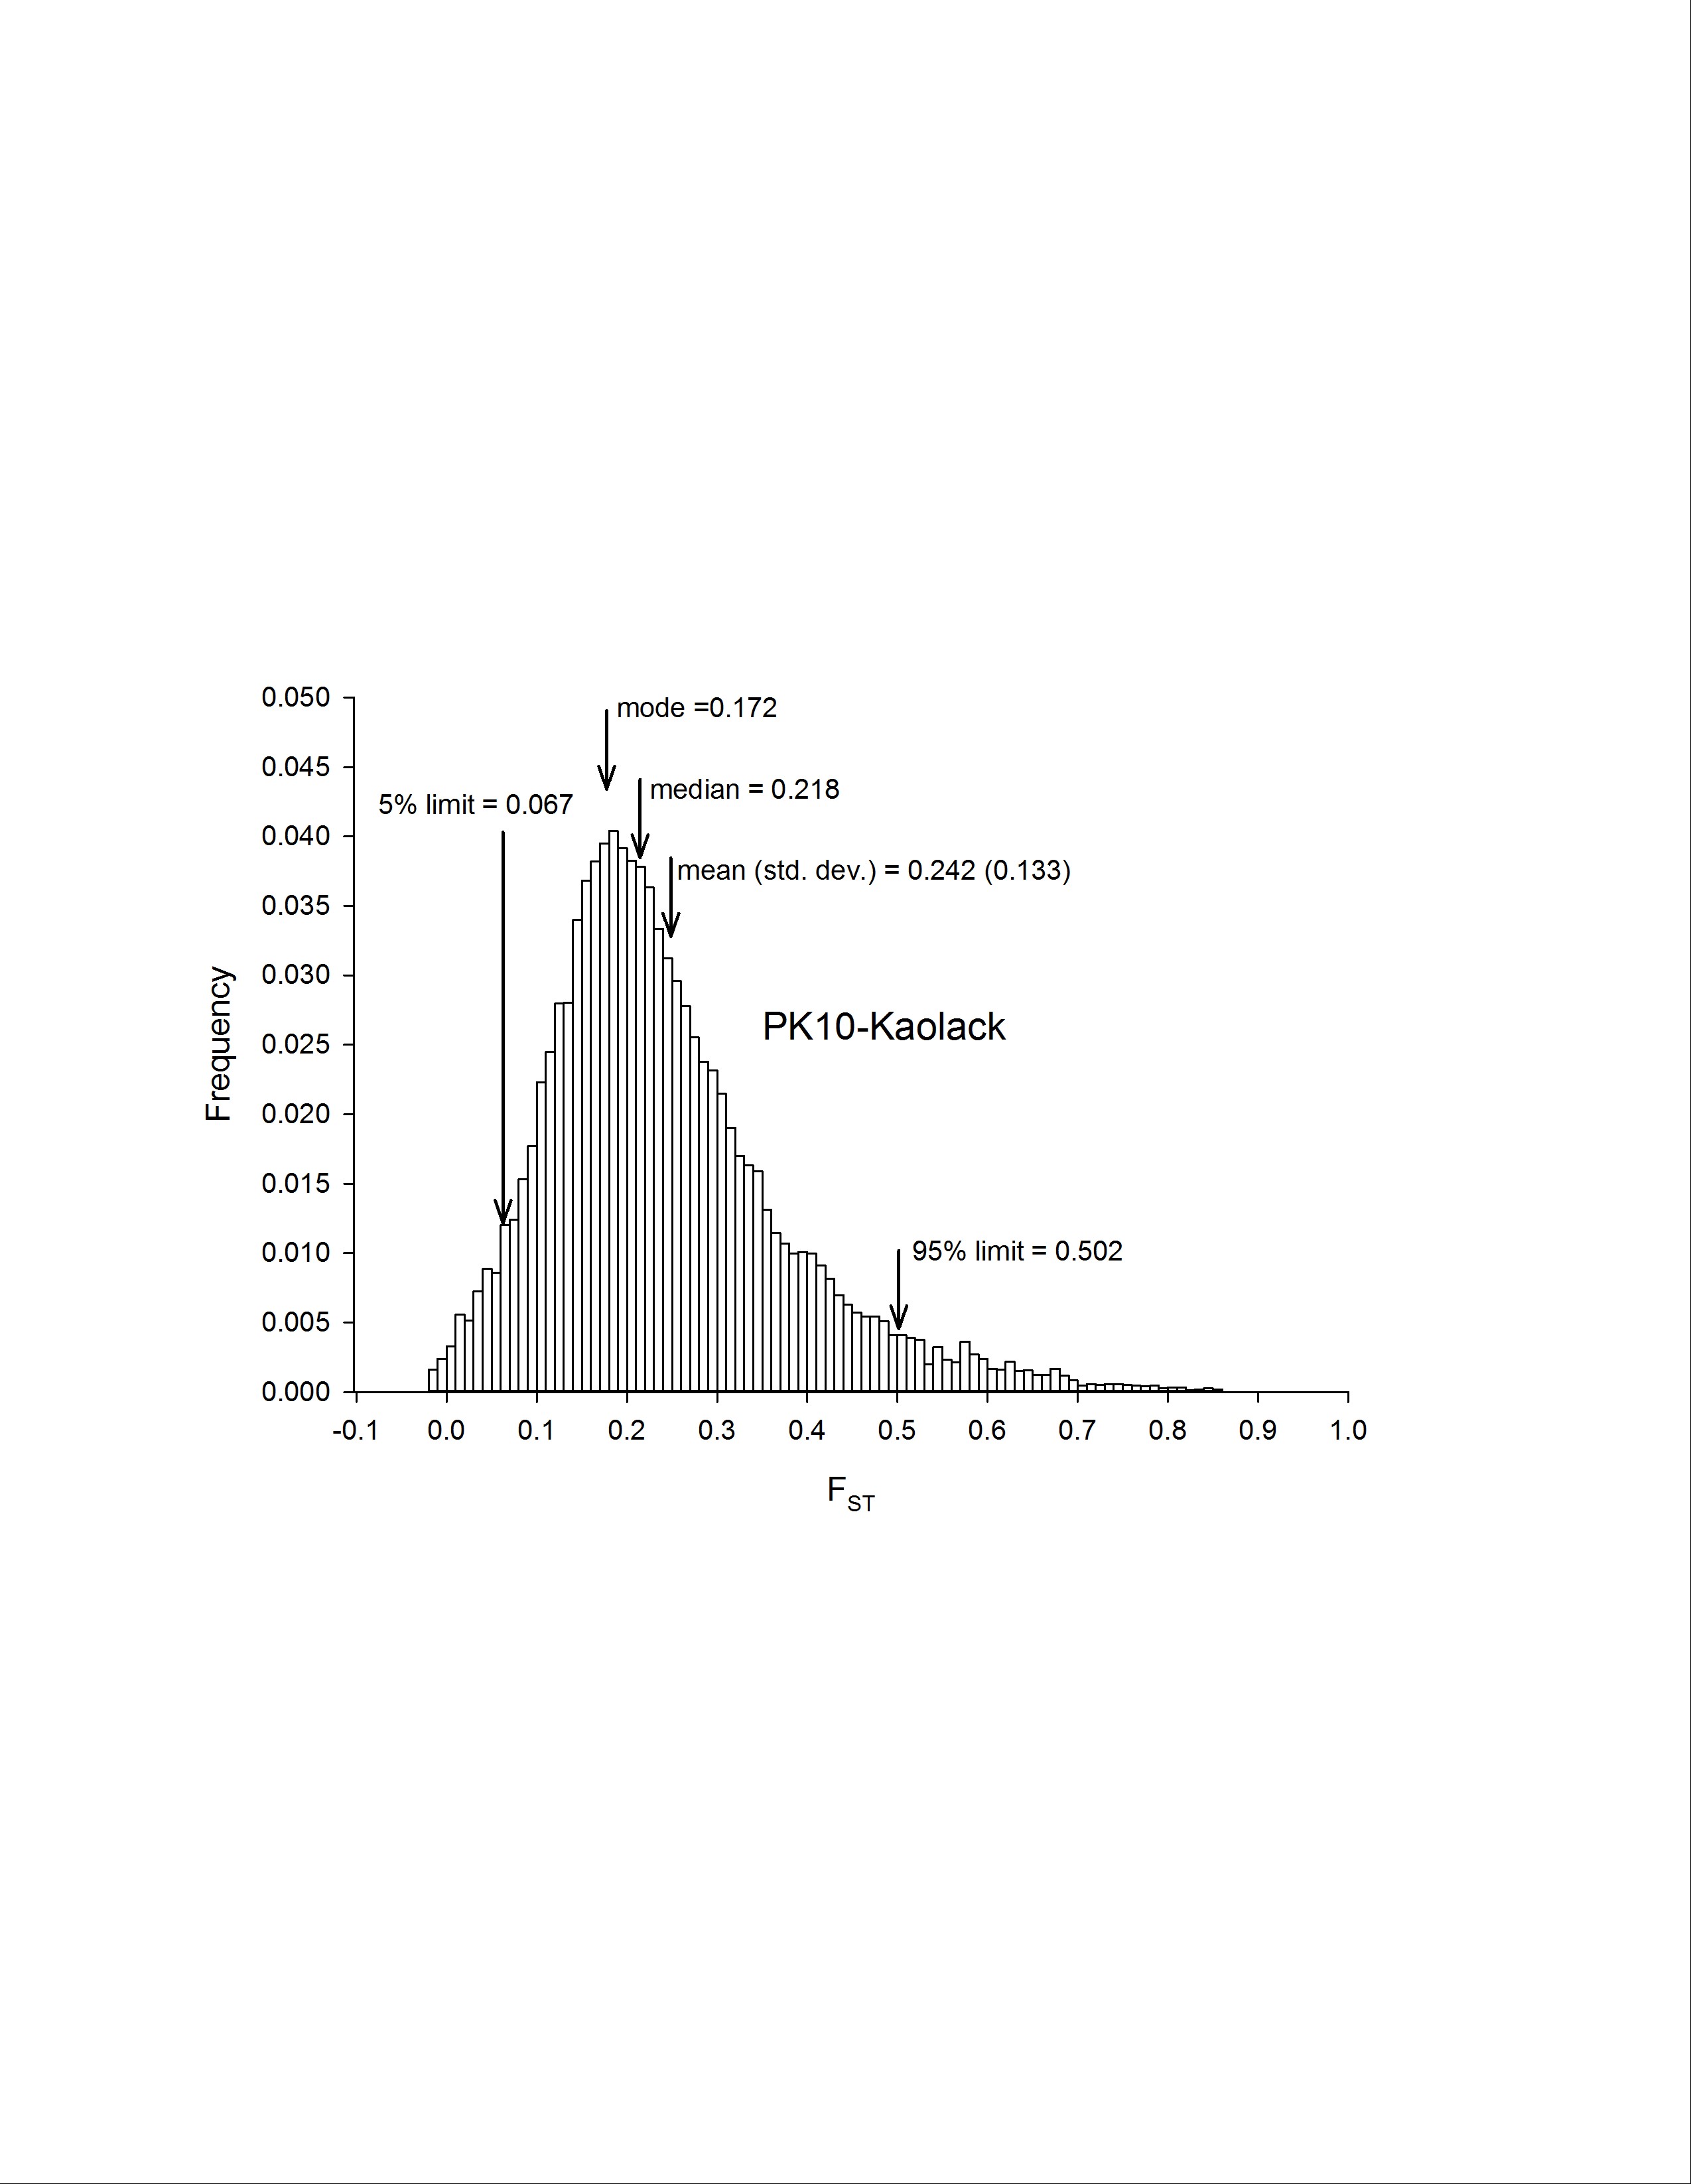
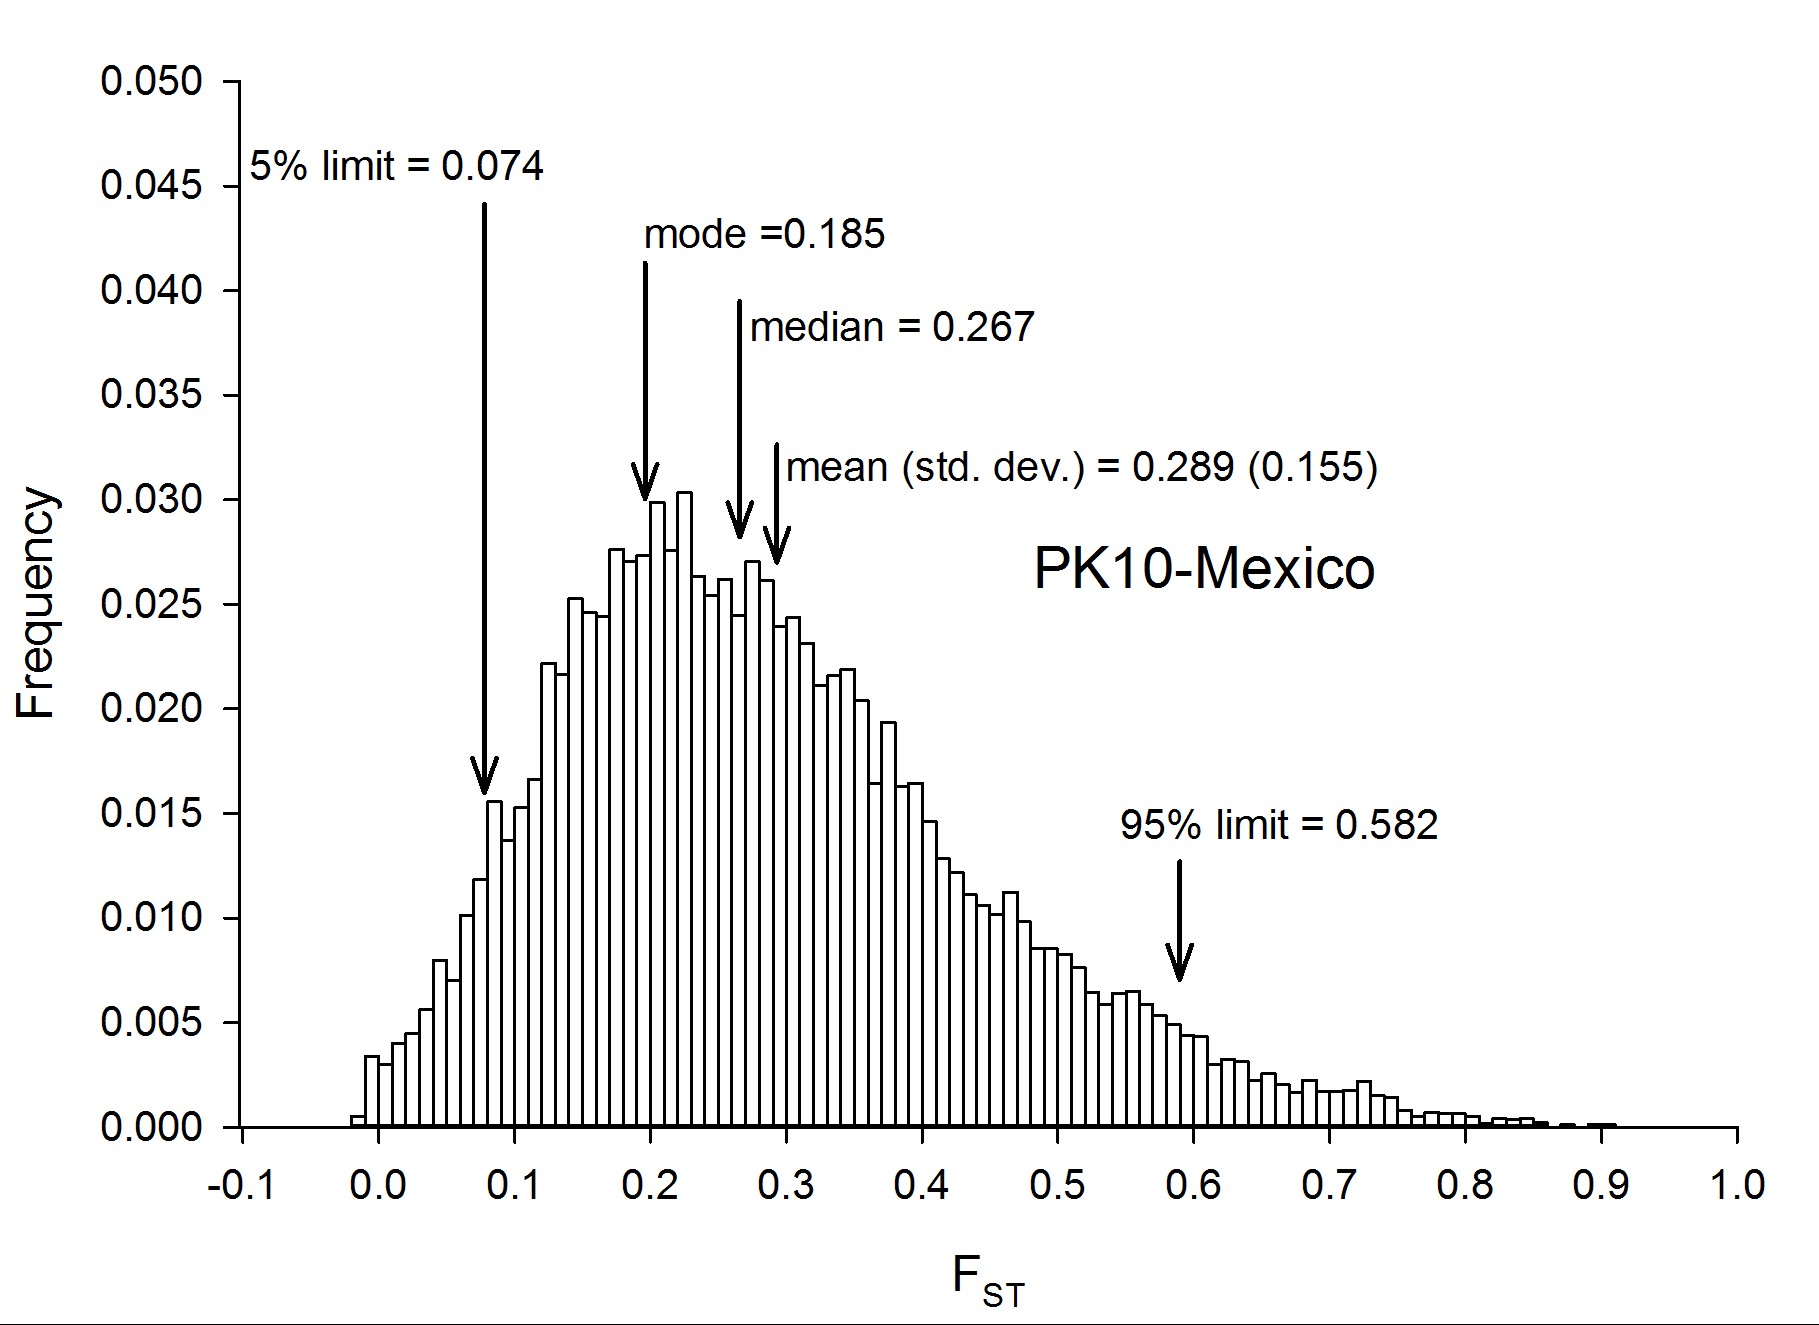
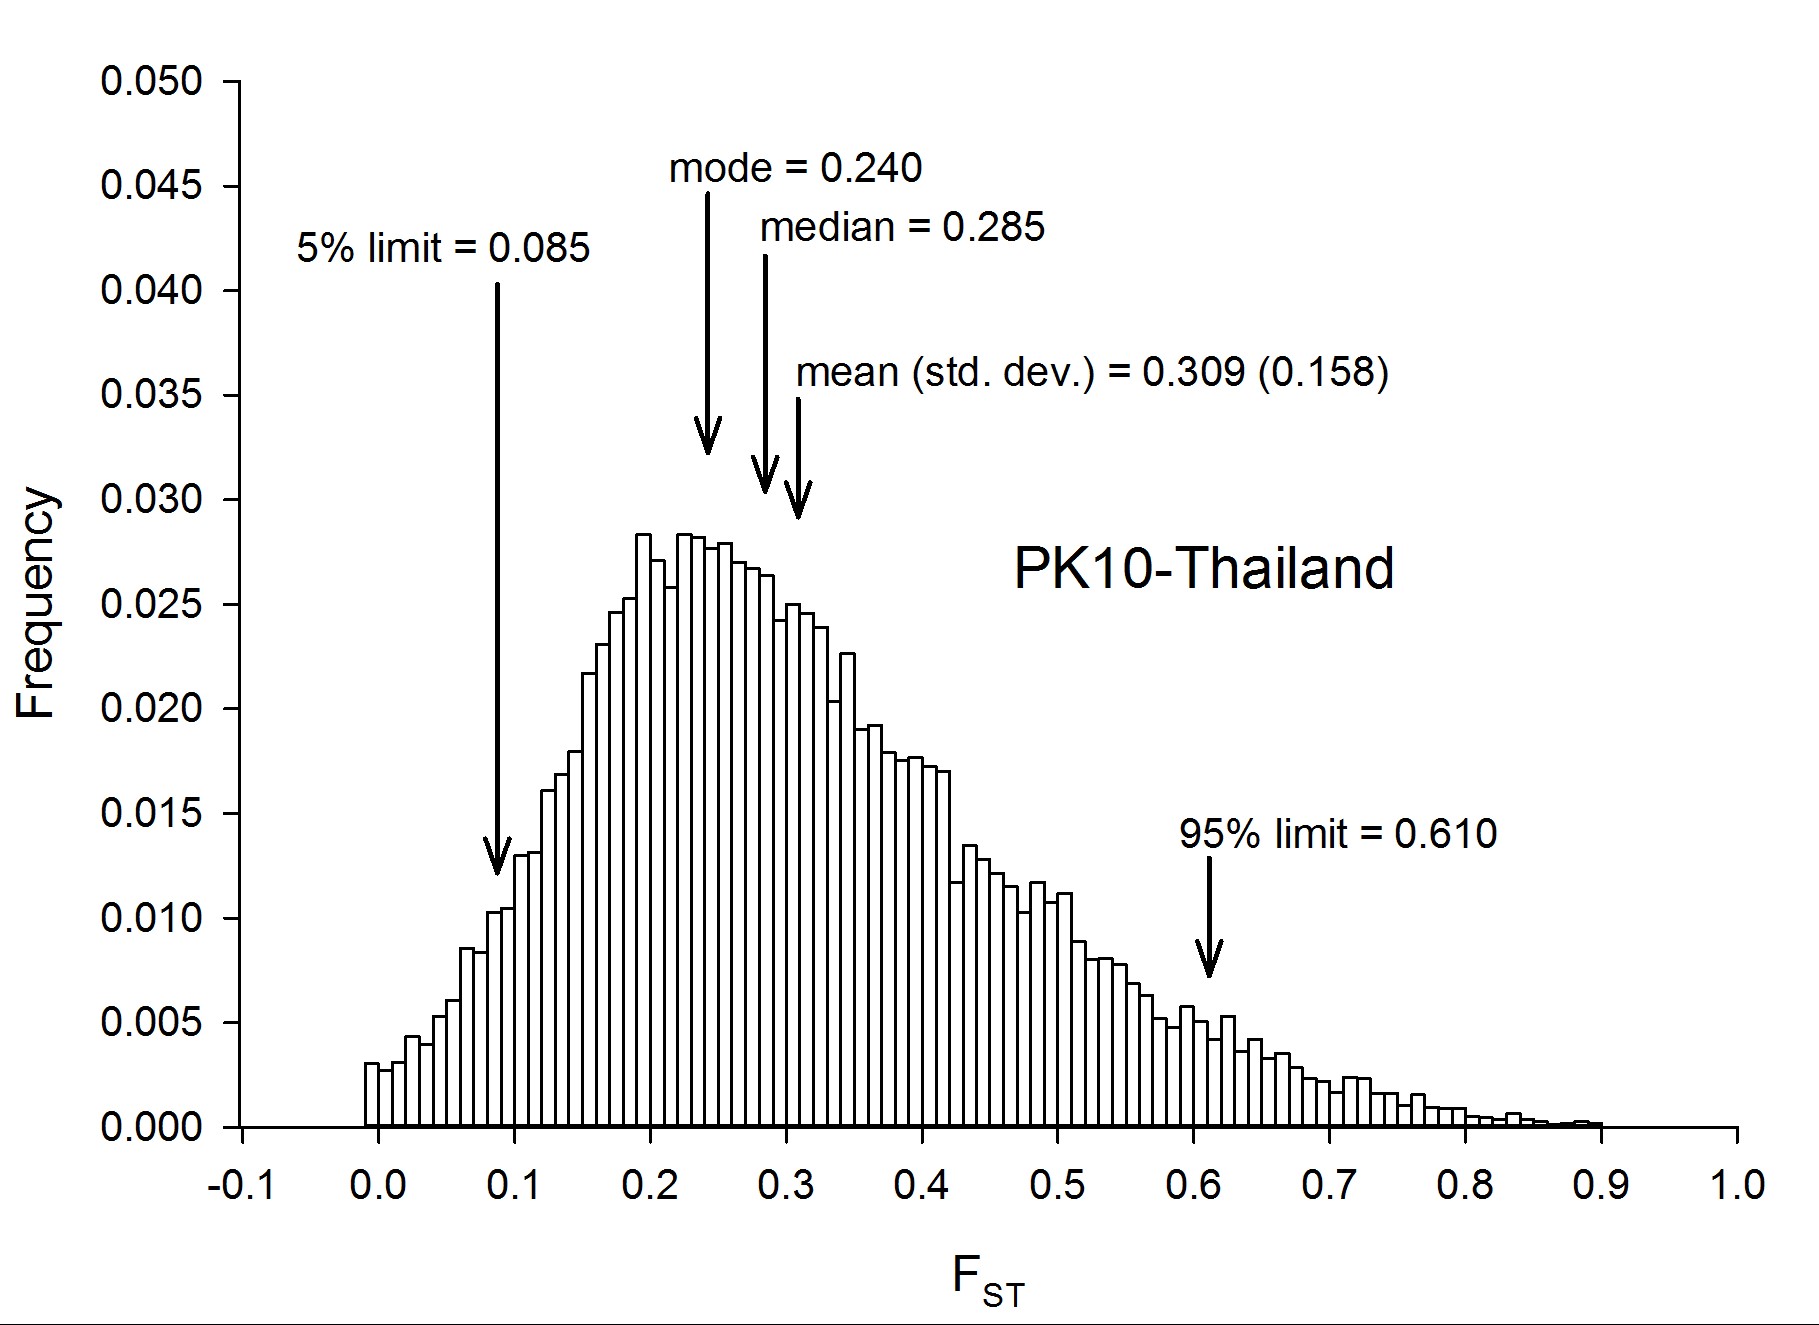
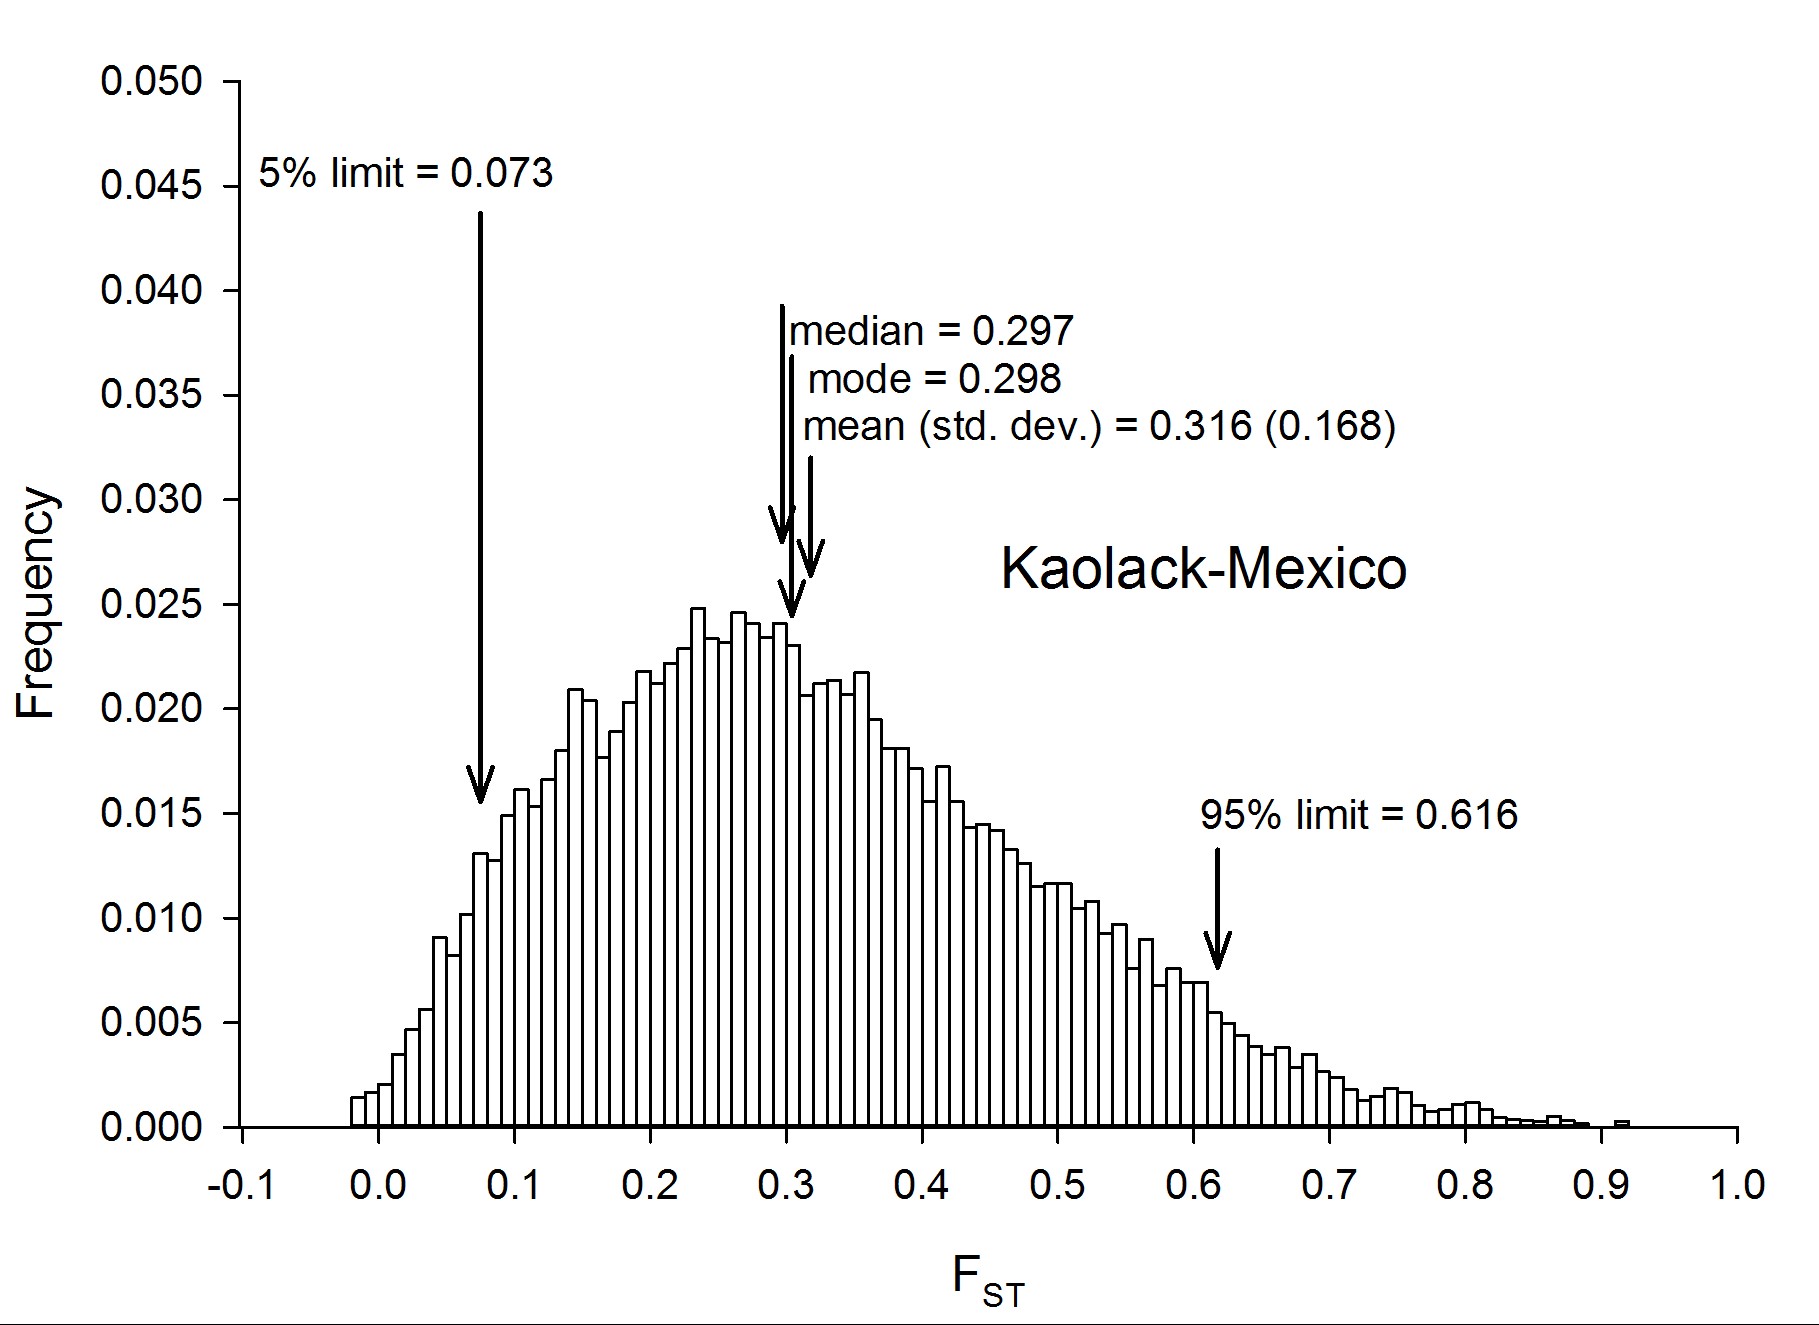
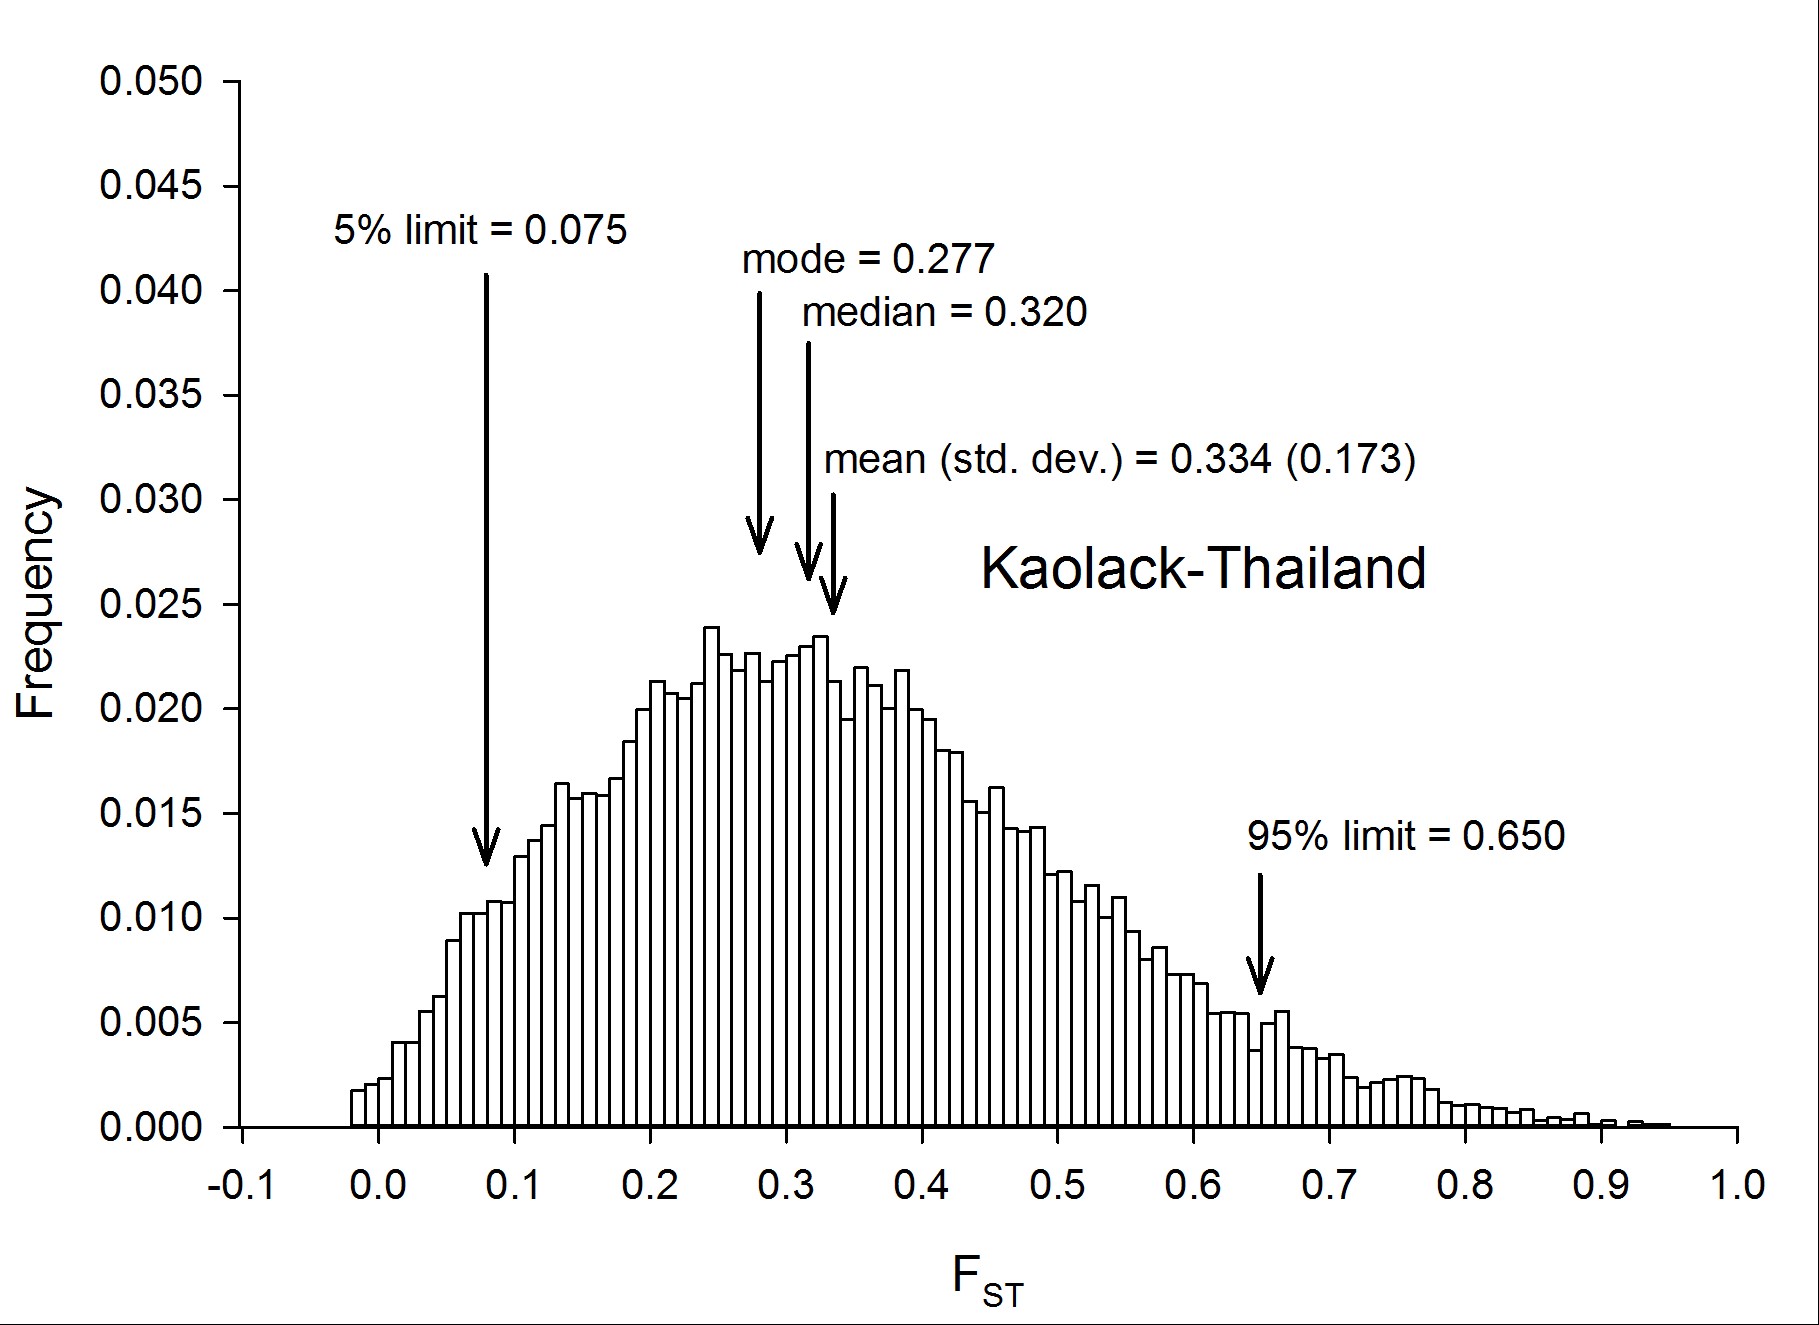
To assess genetic diversity between pairs of collections, FST values were calculated for each of the six pairwise population comparisons, and the distribution of the FST values were plotted with a bin width of 0.01 using “hist(FST),breaks=seq(−0.05, 1, 0.01)” in R 3.1.0 (R Development Core Team 2014) (Figure 2). Each of these distributions are plotted individually in Figure S4, Figure S5, Figure S6, Figure S7, Figure S8, Figure S9, Figure S10, and Figure S11. The red line in Figure 2A is the distribution of pairwise FST values for the genes that occurred in common between Thailand and Mexico (Aaa collections), while the dark blue line is the distribution of pairwise FST for genes shared between PK10 and Kaolack (SenAae collections). The remaining curves are all comparisons between Aaa and SenAae (i.e., Kaolack vs. Thailand, Kaolack vs. Mexico, PK10 vs. Thailand, and PK10 vs. Mexico). Table 3 lists the numbers of genes and SNPs in each pairwise comparison. Also listed are the mean, SD, median, and modal FST values, and the lower 5% and upper 95% FST cutoff values.
![(A) Distributions of pairwise FST values among all six comparisons of the four collection sites. FST values between Aaa collections (red line) are skewed toward smaller values, while FST values between SenAae collections (blue line) were generally larger, and shifted to the right. All four FST distributions between Aaa and SenAae [i.e., PK10 vs. Mexico (black), PK10 vs. Thailand (green), Kaolack vs. Mexico (tan), and Kaolack vs. Thailand (magenta)] had long right-hand tails, indicating larger FST values, and fewer small FST values. (B) FST distributions were compared with one another using a heterogeneity χ2 test of the number of genes in each 0.01 bin along the abscissa in the histogram. The red line is a comparison of FST between Aaa [red in (A)] and between SenAae [blue in (A)] with the four FST distributions curves [black, green, tan and magenta in (A)] between Aaa and SenAae. The left-hand portion of the red curve indicates a large and significant excess of small FST values within the Aaa collection, and within SenAae collections as compared with FST values between Aaa and SenAae. The right-hand region of the red curve indicates a large and significant deficiency of large FST values within Aaa collections, and within SenAae collections. The blue line in (B) is a comparison of the four Aaavs. SenAae FST distributions (i.e., PK10 vs. Mexico, PK10 vs. Thailand, Kaolack vs. Mexico, and Kaolack vs. Thailand). LOD values are never large, indicating that the four curves are similar. The green line is a comparison of the FST distributions within Aaa [red in (A)], and within SenAae [red in (A)]. The left-hand portion of the green curve indicates a large and significant excess of small FST values within Aaa collection as compared within SenAae FST values. The right hand region of the green curve indicates a large and significant deficiency of large FST values within Aaa collections.](https://oup.silverchair-cdn.com/oup/backfile/Content_public/Journal/g3journal/7/2/10.1534_g3.116.036053/4/m_571f2.gif?Expires=1716426499&Signature=GJExFFHN9JT6wX68v6e4vWLCOfD3A11fteCbATkrsXBescZNYVHgZPu~-L0a1CvuDwiwqmsY8QTrYKdm37SPK28xY-bnU8jA7mkJREql-nJ1xcZTWHg9O~WRSb~EW3OO75ytsPwXIUPm8SVsTslSvIZ960EQvea-ywB0nngmiKEBC1QGunF8Wa9Fs5KNIbtSYDsUE49twFCGTPcpLh8VDpFtVU6Fe--~PhVRDwigOWFh0amXv8au3t0bEMRrsvsnAC8V4sWYXGOJdZ7f0pUCVdgCMzyFK4NHvkA~nKLK3tQkvJ6yXPIFvVDLKnQ~RWwNpYX7lJQnaFnW1y5CtelXhQ__&Key-Pair-Id=APKAIE5G5CRDK6RD3PGA)
(A) Distributions of pairwise FST values among all six comparisons of the four collection sites. FST values between Aaa collections (red line) are skewed toward smaller values, while FST values between SenAae collections (blue line) were generally larger, and shifted to the right. All four FST distributions between Aaa and SenAae [i.e., PK10 vs. Mexico (black), PK10 vs. Thailand (green), Kaolack vs. Mexico (tan), and Kaolack vs. Thailand (magenta)] had long right-hand tails, indicating larger FST values, and fewer small FST values. (B) FST distributions were compared with one another using a heterogeneity χ2 test of the number of genes in each 0.01 bin along the abscissa in the histogram. The red line is a comparison of FST between Aaa [red in (A)] and between SenAae [blue in (A)] with the four FST distributions curves [black, green, tan and magenta in (A)] between Aaa and SenAae. The left-hand portion of the red curve indicates a large and significant excess of small FST values within the Aaa collection, and within SenAae collections as compared with FST values between Aaa and SenAae. The right-hand region of the red curve indicates a large and significant deficiency of large FST values within Aaa collections, and within SenAae collections. The blue line in (B) is a comparison of the four Aaavs. SenAae FST distributions (i.e., PK10 vs. Mexico, PK10 vs. Thailand, Kaolack vs. Mexico, and Kaolack vs. Thailand). LOD values are never large, indicating that the four curves are similar. The green line is a comparison of the FST distributions within Aaa [red in (A)], and within SenAae [red in (A)]. The left-hand portion of the green curve indicates a large and significant excess of small FST values within Aaa collection as compared within SenAae FST values. The right hand region of the green curve indicates a large and significant deficiency of large FST values within Aaa collections.
Summary of FST distributions among all pairs of collections
| Collections Compared | No. Genes | No. SNPs | Mean | Median | Mode | SD | Low 5% | High 95% |
|---|---|---|---|---|---|---|---|---|
| Thai sexes | 15,345 | 1,109,671 | 0.015 | 0.007 | −0.003 | 0.032 | −0.013 | 0.068 |
| PK10 sexes | 15,442 | 1,882,229 | 0.030 | 0.014 | 0.000 | 0.047 | −0.009 | 0.129 |
| Mexico/Thailand | 15,435 | 1,165,626 | 0.165 | 0.130 | 0.103 | 0.133 | 0.017 | 0.429 |
| PK10/Kaolack | 15,473 | 1,721,304 | 0.242 | 0.218 | 0.172 | 0.133 | 0.067 | 0.502 |
| PK10/Mexico | 15,453 | 1,266,724 | 0.289 | 0.267 | 0.185 | 0.155 | 0.074 | 0.582 |
| PK10/Thailand | 15,467 | 1,507,065 | 0.309 | 0.285 | 0.240 | 0.158 | 0.085 | 0.610 |
| Kaolack/Mexico | 15,452 | 1,665,639 | 0.316 | 0.297 | 0.298 | 0.168 | 0.073 | 0.616 |
| Kaolack/Thailand | 15,478 | 1,665,753 | 0.334 | 0.320 | 0.277 | 0.173 | 0.075 | 0.650 |
Four trends are evident. First, FST values between Thailand and Mexico are positively skewed, indicating that the majority of genes are similar between the two Aaa collections, despite the fact that the collection sites are ∼14,950 km apart (shortest arc distance). Second, pairwise FST values between the Kaolack and PK10 collections, which are ∼450 km apart, are shifted to the right, indicating that genetic differences between the two SenAae collections were greater than between the two Aaa collections. Third, FST values distributions between Senegal and the Thailand and Mexico collections are strongly shifted to the right, indicating large FST differences between SenAae and Aaa. LOD scores of a heterogeneity χ2 test are consistent with these observations (Figure 2B). Fourth, in examining Figure S4, Figure S5, Figure S6, Figure S7, Figure S8, Figure S9, Figure S10, and Figure S11, it is clear that the distribution of FST values between any two collections is not normally distributed, but rather is highly skewed. This is especially evident when comparing sexes in a collection (Figure S4 and Figure S5). Furthermore, the FST distribution shifts to the right as collections diverge genetically. For example, in comparing Mexico and Thailand collections (Figure S6), the mean FST (0.165 ± 0.130) is larger than the median (0.130), which in turn is larger than the mode (0.103). Furthermore, the curve underlying the lower 5% FST values, and the curve underlying the upper 95% FST values are asymmetrical in shape and distribution (Figure S6). Only when collections become extremely divergent (e.g., Figure S8, Figure S9, Figure S10, and Figure S11) do the mean, median, and mode begin to converge. All of these inequalities arise because the genome-wide distribution of FST values is not normal. Therefore, centrality measures fail to capture the genome-wide variation in FST, and summaries of genetic relationships based upon point estimates (mean, median, and mode) are misleading, and also miss the point of a population genomics analysis, which is to examine and compare patterns of variation across the entire genome.
Genetic differences between sexes in Ae. aegypti collections
Our previous observations of chromosomal rearrangements on chromosome 1, along with the presence of the sex-determining locus (SDL) on chromosome 1 (Dickson et al. 2016), lead us to explore possible sex-specific chromosomal differences between dual replicate pools of males and females in the deep sequencing data in PK10 and Thailand. Roughly the same percentage of SNPS were polymorphic in the sexes in PK10 (6.74% in females and 6.85% in males) and Thailand (4.13% in females and 4.41% in males) (Table 1). Hexp in PK10 females was greater than Hexp in males at 54% of genes. Hexp in Thailand females was less than Hexp in males in 45% of genes.
In addition to the FST sampling distributions between sexes (Figure S4 and Figure S5), FST values between sexes in both the PK10 and Thailand collections were mapped for each gene across the three chromosomes (Figure 3). Visual comparison of FST values on chromosome 1 in the PK10 and Thailand strains indicates that sex-specific differences were generally larger on chromosome 1 of the PK10 strain. Comparison of FST values on chromosome 1 between PK10 and Thailand were highly significant (pairwise-t = 26.9, d.f. = 1934, p-value = 1.15 × 10−135), and PK10 FST values were greater than Thailand FST values in 1387 of the 1935 genes compared (71.6%). These differences were distributed uniformly along chromosome 1, and did not appear to pile up in one or a few regions, as would be expected if the differences were associated with a single sex-determining locus. However, ∼50% of the Ae. aegypti genome remains unannotated, and recent work on mapping with the same markers used in this study revealed many cases where genes were misassembled (Juneja et al. 2014). Thus, it is possible that large FST values associated with markers on chromosomes 2 and 3 could actually map to chromosome 1. On chromosome 2, FST values were also significantly greater in PK10 (t = 12.6, d.f. = 3391, p-value = 1.31 × 10⁻³⁵), and PK10 FST values were greater than Thailand FST values in 2110 of 3392 genes compared (62.2%). In contrast, on chromosome 3, FST values were actually significantly lower between PK10 sexes (t = −6.50, d.f. = 2354, p-value = 9.64 × 10⁻¹¹), and PK10 FST values were greater than Thailand FST values in 1050 of 2355 genes compared (44.6%).
Comparison of FST values between sexes for genes that have been mapped across the three chromosomes in the PK10 (SenAae) and Thailand (Aaa) collections.
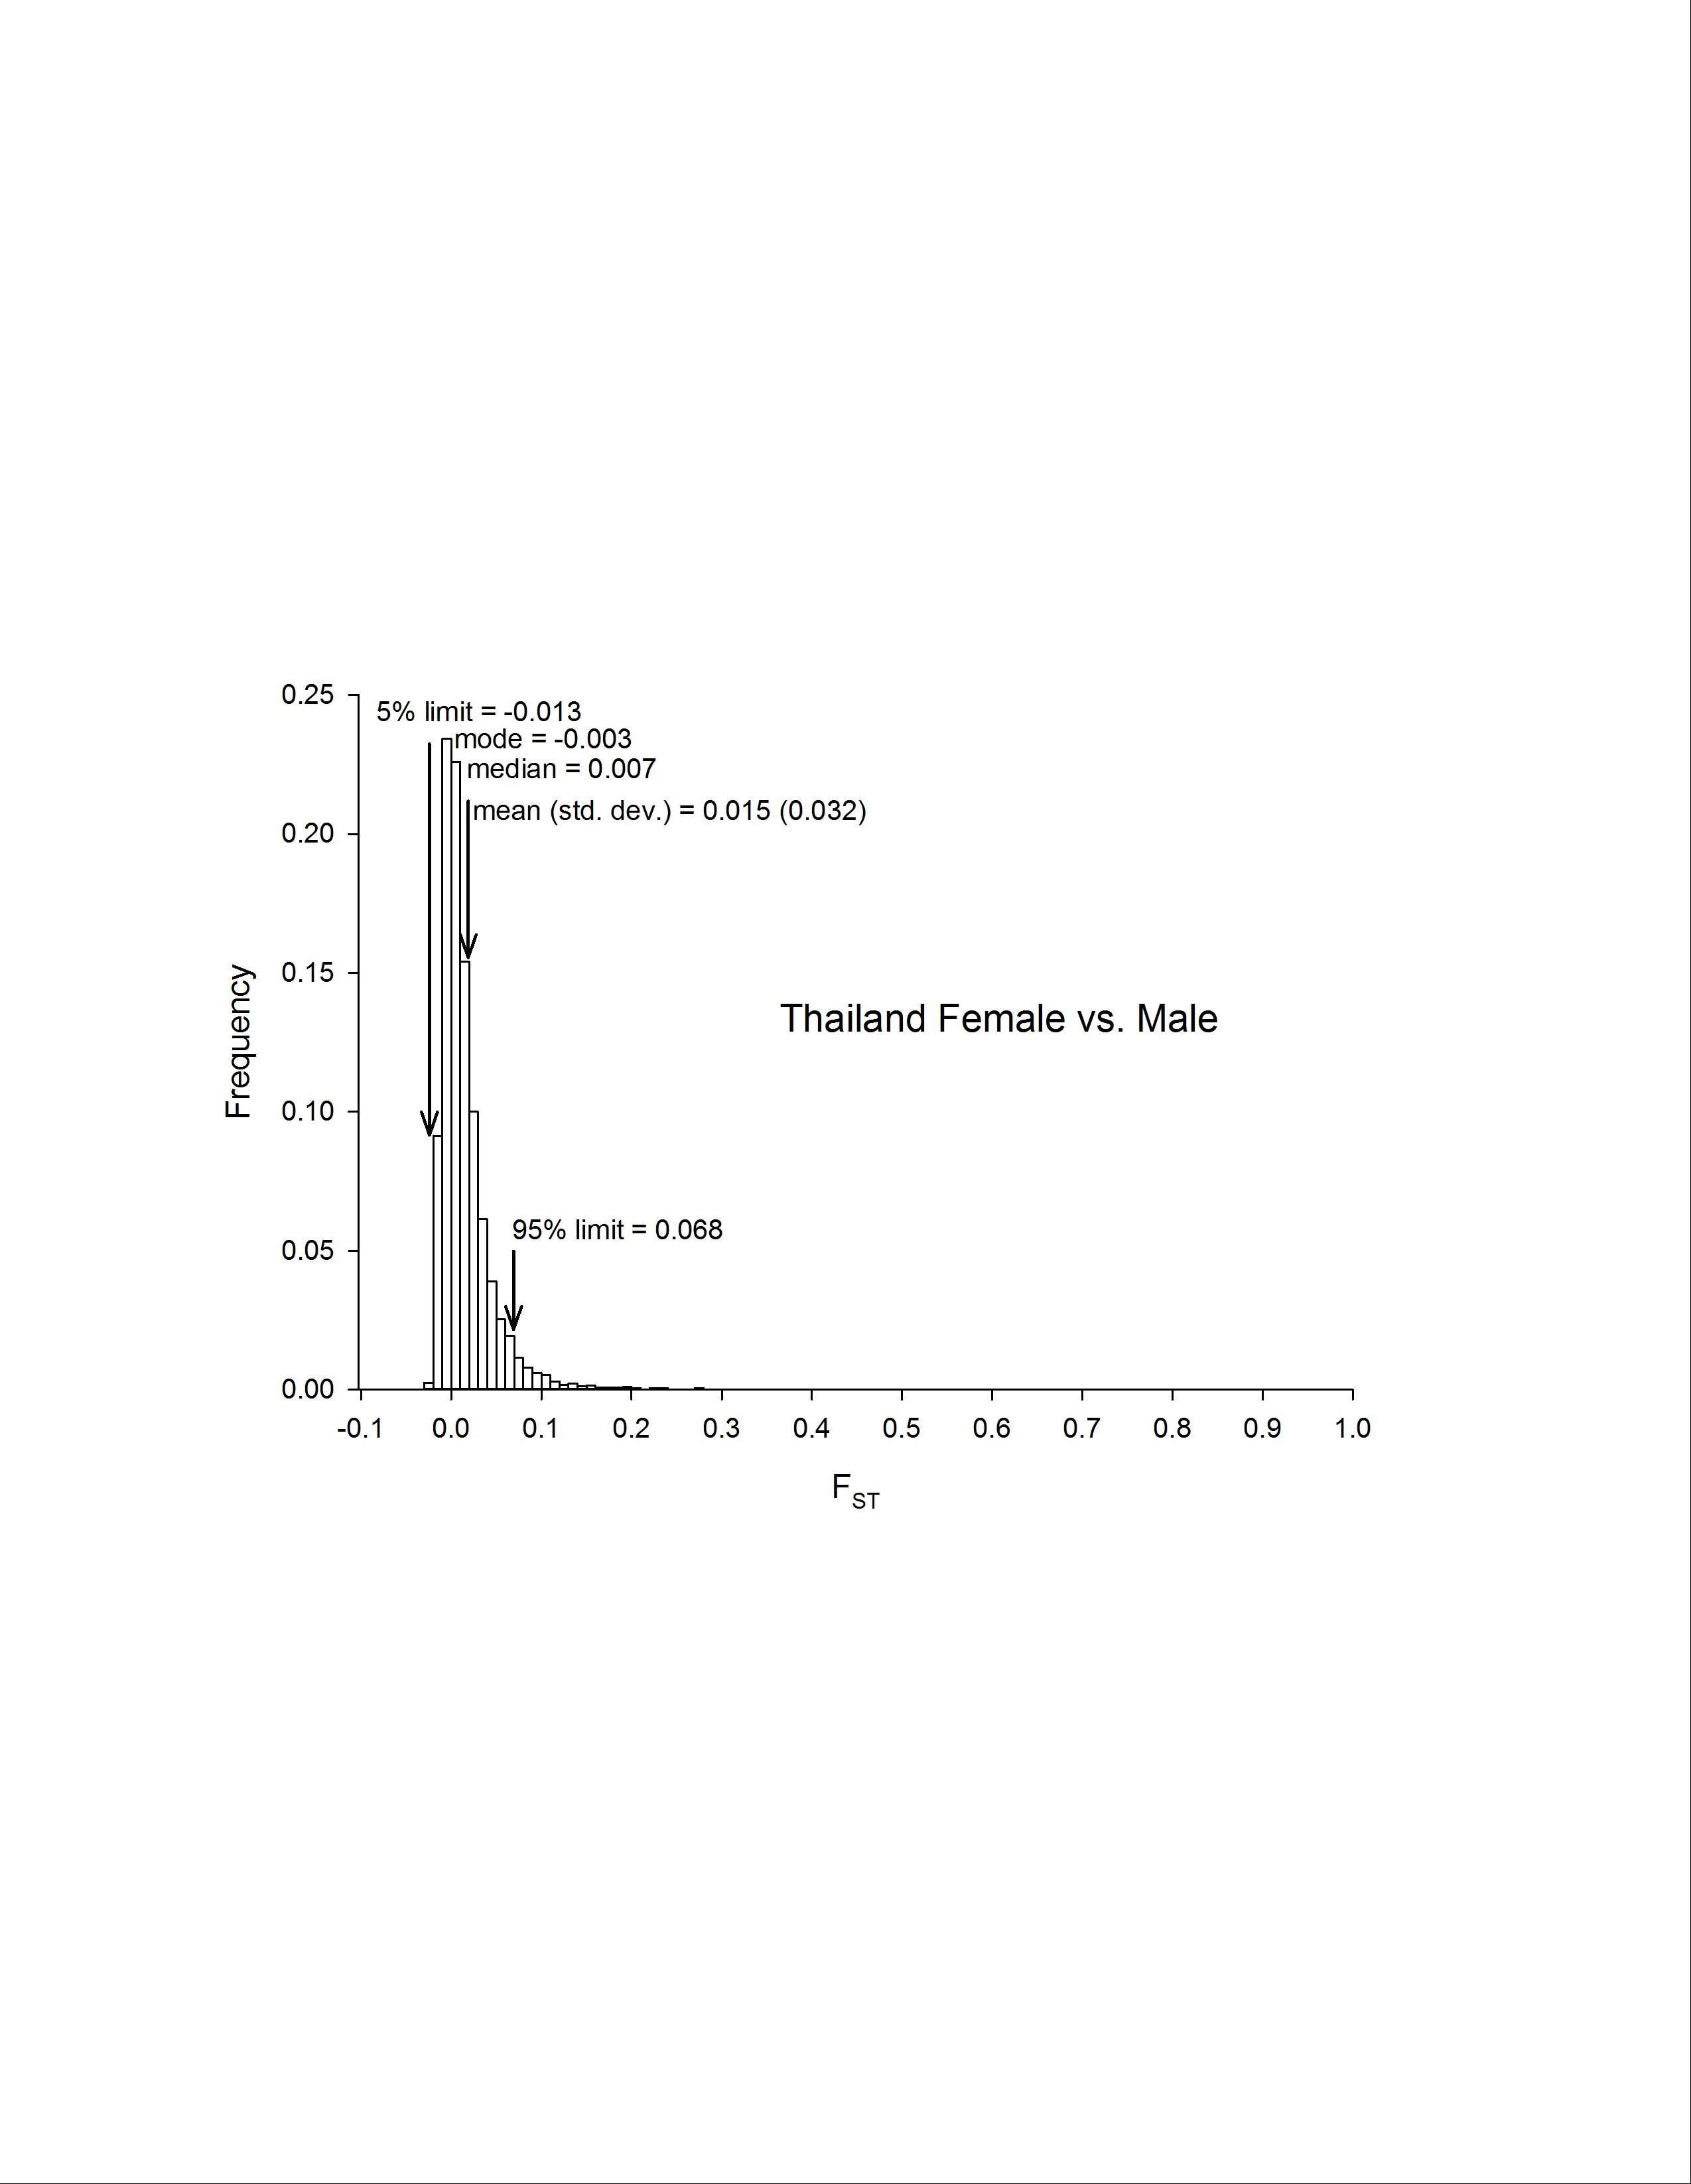
Figure 4 suggests greater differences in SNP frequencies between sexes on chromosome 1 within PK10 than among genes on all three chromosomes within Thailand. To test this further, the distribution of FST values between sexes was plotted for all three chromosomes (Figure 4). The distribution of FST values are very similar among all three chromosomes in the Thailand collection (Figure 4A). All three distributions were compared against one another using a 3 × 2 heterogeneity χ2 test of the number of genes in each 0.01 bin. None of the values crossed the LOD = 3.0 threshold. In contrast, the distribution of FST values are different between sexes on all three chromosomes in PK10 (Figure 4B). Specifically, the FST distribution for chromosome 1 is strongly shifted to the right, while, for chromosome 2, the distribution is slightly shifted to the right, and for chromosome 3, the distribution is positively skewed. FST from 0 to 0.2 cross the LOD = 3.0 threshold. Thus, while markers on all three chromosomes are at similar frequencies in the two sexes in the Thailand Aaa populations, they are at strikingly different frequencies between PK10 sexes.
Distribution of FST and LOD values between sexes plotted on each chromosome. FST distributions were compared with one another using a heterogeneity χ2 test of the number of genes in each 0.01 bin along the abscissa in the histogram. (A) FST distributions are very similar among all three chromosomes in the Thailand collection. The magenta line indicates the LOD value across the chromosomes, while the black dashed line is the LOD = 3 cutoff. LOD values never exceed the LOD = 3 cutoff. (B) FST distributions differ among all three chromosomes in PK10 (SenAae). LOD values across the chromosomes exceed the LOD = 3 cutoff across all three chromosomes.
Figure 5 repeats the analyses on Figure 3 and Figure 4, but compares FST values according to the gene region in which the SNP occurred including codon positions 1, 2, and 3, introns, 5′UTR, and 600 bp on the 5′NTR, 3′UTR, and 600 bp on the 3′NTR. When comparing sexes in Thailand, FST values were greatest among SNPs in the 5′ and 3′ UTRs, and least among SNPs in the second codon position. Values were virtually equivalent on all three chromosomes, and including unmapped regions. FST values were also compared among the four types of mutations (transition, transversion, insertion, and deletion) giving rise to the SNP. FST values were equivalent between transitions and transversions, slightly lower for insertions, and lowest for deletions. Again, FST values were virtually equivalent on all three chromosomes and in unmapped regions. FST values were finally compared among SNPs occurring in codons that encoded a silent or replacement substitution. While FST values among silent SNPs were higher than among replacement SNPs, FST values were virtually equivalent among all three chromosomes and including unmapped regions.
Average sex-specific FST values for SNPs in different regions of a gene. Values were plotted by chromosome in (A) Thailand (Aaa) females vs. males, and (B) PK10 (SenAae) females vs. males.
In contrast, when comparing sexes in PK10, FST values between sexes were greatest among SNPs in the third codon position and in the 5′ and 3′ UTRs, and least among SNPs in the second codon position and introns. Values differed greatly among chromosomes and unmapped regions. The largest FST values occurred on chromosome 1 among all eight gene regions. The second largest FST values occurred on chromosome 2 among all eight gene regions, while the smallest FST values occurred on chromosome 3. The unmapped markers represent an average of all three chromosomes. Similar trends are evident among the transition, transversion, insertion, and deletion SNPs, and among SNPs encoding silent and replacement substitutions.
Discussion
In keeping with earlier studies, the percentage of polymorphic SNPs and Hexp was greatest in the African Ae. aegypti collections. This is consistent with the idea that Ae. aegypti arose as a species somewhere in the African continent (Tabachnick 1991, 1979). A total of 490 genes occurred in the lower 1% tail of the four Hexp distributions, and most (77% = 376/490) occurred in only one collection, while only five genes (1%) had low Hexp in all collections (Figure S2). In contrast, 324 genes occurred in the upper 1% tail of the four Hexp distributions, and a smaller percentage (49% = 160/324) occurred in only one collection, while 44 genes (13.8%) were common in all four collections (Figure S3). Many of the genes in Table S1, have hundreds or thousands of SNPs. This probably reflects a pattern of neutral evolution, wherein a forward mutation rate generates new SNPs independently among genes and among SNPs within genes. In the context of this project it would be assumed that a mutation (SNP) arose only once in single collections (infinite alleles model), and drift would cause the majority of these to become extinct in a few generations, depending upon the effective population sizes. In contrast, the genes that occur in common among the four collections are probably maintained at a low Hexp by purifying selection. For example, 24 of the low Hexp genes encode rRNA genes that would be expected to be under strong purifying selection, and homogeneous due to the molecular drive operating in the rDNA cistron (Table S2).
By comparison, the 324 genes that had a high Hexp (Table S3) do not follow a pattern consistent with neutral evolution, and, instead, are either not constrained by purifying selection, or are subject to some form of diversifying selection. Curiously 35.4% (115/325) of these encode either tRNAS(86), tRNA pseudogenes(19), or, while annotated as tRNAs in VectorBase, 10 could not be confirmed with tRNAscan-SE/ (Schattner et al. 2005). Forty-four high Hexp genes (14%) occurred in common among all collections (Figure S2). Half of these 44 genes coded for noncoding RNAs (ncRNAs), 21 of which were tRNAs, and one was the U2 spliceosomal RNA gene (AAEL017645). This suggests a common lack of purifying selection, or diversifying selection, acting upon these genes in all collections.
Ae. aegypti has 962 annotated nuclear-encoded transfer RNA (tRNA) genes arranged in 61 genomic clusters, with 111 predicted as pseudogenes (Behura and Severson 2011; Lawson et al. 2007; Schattner et al. 2005). Members of the tRNA functional class were present in both the high Hexp (116 tRNAs) and low Hexp (22 tRNAs) (Table S1 and Table S2). The majority of low Hexp occurred in SenAae (Table S2), while the highest Hexp occurred in all collections. Of these, 62% had anticodons predicted to have preferred codon usage (Behura and Severson 2011). Curiously, 32% (7/22) of the low Hexp, and 19% (19/113) of high Hexp tRNAs, were predicted to be pseudogenes (Schattner et al. 2005).
Why do aedine mosquitoes have many tRNA isoacceptor gene copies? Moreover, why is a subset of pseudogenes highly conserved? Varied codon usage, which would partially contribute to multiple tRNA copy numbers, has been suggested to be pertinent to specific metabolic pathways (Behura and Severson 2011), and could affect stage-specific expression patterns. Moreover, tRNAs also participate in regulatory activity, as tRNA fragments have been found to regulate sperm maturation in mammals (Sharma et al. 2016). Supportive evidence in aedine mosquitoes has also been described; for example, there is evidence for general RNA transfer in seminal fluid (Alfonso-Parra et al. 2016). Moreover, tRNA fragments (15–30 nt) have been isolated from small RNA (sRNA) sequencing pools (Hess et al. 2011). Although the mechanistic details of possible tRNA regulation are yet to be elucidated in mosquitoes, these studies, coupled with the presence of over 100 tRNA genes showing high Hexp values, is consistent with the hypothesis that tRNA polymorphisms may arise during speciation.
FST differences were most pronounced between the two SenAae collections, and between SenAae and Aaa. FST values were ranked from smallest to largest, and genes with the lowest 1% of FST are listed in Table S3, and those with the highest 1% of FST appear in Table S4. Fifty genes occurred within the lowest 1%. Of these, none occurred only once or twice, 29 occurred three times, none occurred four times, 15 occurred in five comparisons, and six occurred in all comparisons, suggesting these are highly conserved across populations. AAEL017730 was predicted to encode a novel miRNA, but was not similar to any known hexapod miRNAs (Griffiths-Jones et al. 2008). AAEL006000-RC is predicted to encode cytochrome c oxidase polypeptide 7A1—one of the nuclear-coded polypeptide chains of cytochrome c oxidase, the terminal oxidase in mitochondrial electron transport. AAEL008026-RA encodes an MADF (myb/SANT-like domain in Adf-1), where the SANT domain (acronym for Swi3, Ada2, N-Cor, TFIIB) is a highly conserved motif. In Drosophila, Adf-1 encodes a transcription factor that binds the promoters of a diverse group of genes (England et al. 1992). AAEL016955-RA encodes a tRNA-Asp, while AAEL006284-RA and AAEL006943-RA encode hypothetical proteins.
Similarly, the upper 1% of FST values were interrogated for each of the six pairwise comparisons (Table S4). Of 48 genes, only CYP6P12 (AAEL014891) occurred in all comparisons. The remaining genes all appeared three times. CYP6P12 is a major insecticide detoxification gene (Saavedra-Rodriguez et al. 2014). Several other genes known to be involved in insecticide resistance occurred in the upper 1% of FST values. AAEL012491-RA encodes a different CYP6P12, while four epsilon glutathione-S-transferases (2, 4, 6, and 7) appear in this list. This in consistent with an hypothesis that insecticidal pressure [very high in Mexico (Flores et al. 2013) and Thailand (Bosio et al. 2005), very low or nonexistent in Senegal (Sylla et al. 2013)] has promoted directional selection, and caused large differences in the frequencies of SNPs. Reductions in heterozygosity usually accompany directional selection with insecticides. The average Hexp among the four epsilon GSTs was PK10 (0.166), Kaolack (0.210), Mexico (0.061), and Thailand (0.023), but Hexp among the CYP6P12 was: PK10 (0.130), Kaolack (0.140), Mexico (0.166), and Thailand (0.038).
In the process of completing this study, we learned an important technical aspect of next generation sequencing (NGS) when applied to species (such as Ae. aegypti) with large genomes that contain a high percentage of repetitive DNA (Warren and Crampton 1991). Early on in this investigation, we tried to perform the same NGS analyses but without exon enrichment. From 23 to 37 × 106 sequences were recovered in each of the 12 libraries; however, codon regions were detected in <5% of all recovered sequences. Reassociation kinetics of the Ae. aegypti genome (Warren and Crampton 1991) indicated that 40% of the genome consisted of fold-back, highly repetitive, and middle repetitive DNA. Perusal of VectorBase indicates that much of the remaining “unique” DNA consists of transposable elements. Most importantly, analysis of these unenriched datasets provided no resolution of subspecies (Figure 1 and Figure 2), nor did it identify many differences between sexes (Figure 4 and Figure 5).
The results of this study suggest that genes from throughout the genome are similar between Aaa from two geographically distinct locations. SenAae genomes also differed from one another to a large extent in the present study, but, more notably, differ greatly between Aaa and SenAae. We have yet to determine how SenAae are related to East African Aaf, but this same pattern was evident in the recent study of worldwide collections of Ae. aegypti (s.l.) by Evans et al. (2015) using a 50,000 SNP-Chip. In particular, their principal components analysis (PCA) of collections from Africa, Asia and the Pacific, and the Americas (Figure 3B in Evans et al. 2015) showed that the five Americas collections formed a very tight overlapping cluster distinct from, but on the same side of the PCA, as the four Asia and the Pacific collections, which formed three distinct clusters. In contrast, African collections (including two SenAae but neither PK10 nor Kaolack) formed very large clusters. One apparent difference between the PCA and results in the present study is that Thailand and Mexico collections in the PCA appear to be more distinct than in our comparison of FST distributions. However, our results do not necessarily contradict those of Evans et al. (2015). First, collection sites in Thailand differed between the two studies. Second, referring to Panel B of the PCA in Figure 3 of Evans et al. (2015), the Thailand (purple squares) and Tapachula (gold diamonds) collections are extremely close along the PC1 axis that accounts for 13.2% of the variation in SNP frequencies. Thailand and Tapachula only separate along PC2, which accounts for only 4.5% of the variation. Third, PC1+PC2 account for only 17.7% of the overall variation, indicating that 82% of the variation in SNP frequencies is unexplained by the first two PCs. Fourth, PCA is an analysis of individuals, while our analysis of FST is based on collections of individuals. Evans et al. (2015) does not indicate how much variation exists among individuals in a collection (this appears for our data in Figure 1). Could within-collection variation among individuals account for a large part of the 82% of unexplained variance? Finally, Figure S4, Figure S5, Figure S6, Figure S7, Figure S8, Figure S9, Figure S10, and Figure S11 show that summary of genetic relationships based upon point estimates (mean, median, mode, and variance) is misleading.
These patterns in genic diversity correlate with the reproductive isolation patterns noted in our earlier study (Dickson et al. 2016). In that study, attempts to construct F1 intercross families between Aaa laboratory strains and SenAae failed due to poor F1 oviposition and low F2 egg-to-adult survival. Backcrosses were performed to test for postzygotic isolation patterns consistent with Haldane’s rule modified for species, like Aedes, that have an autosomal SDL (Presgraves and Orr 1998). However, these crosses were inconclusive with regards to Haldane’s rule. Instead, basic cytogenetic analyses and FISH experiments revealed many rearrangements between SenAae and Aaa. Linkage analysis of the SDL, and the white-eye locus, identified a likely chromosomal rearrangement on chromosome 1. Another rearrangement was close to the centromere on the p arm of chromosome 2. Two overlapping pericentric inversions were found on chromosome 3, or an insertion of a large fragment into the 3q arm. The reproductive incompatibility observed within SenAae, and between SenAae and Aaa, may be generally associated with chromosome rearrangements on all three chromosomes, and specifically caused by pericentric inversions on chromosomes 2 and 3. Chromosomal rearrangements have frequently been associated with speciation in taxa, including mosquitoes (Kitzmiller 1963). Pericentric inversions are only rarely detected within animal species, but can be abundant among species (Coyne and Orr 2004; Orr and Coyne 1989). Acentric fragments and dicentric “bridge” chromosomes arise when recombination occurs in parents that are heterozygous for pericentric inversions. These, in turn, yield aneuploid gametes and inviable zygotes.
We hypothesize that cryptic Ae. aegypti taxa exist in West Africa, or that new subspecies of Ae. aegypti are arising in West Africa. We propose that the large genic differences between Aaa and SenAae documented in the present study have accumulated over a long period of time, possibly following the occurrence of chromosome rearrangements in allopatric populations that subsequently caused the taxa to become reproductively isolated when populations became sympatric. It may be that PK10 represents a collection of at least two fully, or partially, reproductively isolated taxa. If so, it is curious that the largest differences between PK10 females and males occur on the sex autosome 1 (Figure 3). Sex determination is governed by a dominant male-determining “M” allele in the sex determination locus on chromosome 1 in Ae. aegypti. The SDL gene “Nix” has recently been identified. Nix exhibits persistent M linkage and early embryonic expression (Hall et al. 2015); however differences between PK10 females and males were not limited to one region of chromosome 1. It has been proposed that sexual selection may drive the more rapid evolution of male-expressed genes (Wu and Davis 1993; Wu et al. 1996; Coulthart and Singh 1988), as well as variation in expression of male-expressed genes (Harrison et al. 2015). More rapid male evolution would also explain Haldane’s rule because hybrid male sterility would occur before hybrid female sterility. Experiments in Drosophila suggest that faster male evolution causes Haldane’s rule for sterility (Hollocher and Wu 1996; Harrison et al. 2015; True et al. 1996). Unfortunately there is no information to suggest that male-expressed genes occur primarily on chromosome 1 or within the region containing Nix (Hall et al. 2015).
Herein, we have demonstrated large amounts of genic differentiation between SenAae and Aaa populations outside Africa, and earlier have provided evidence for chromosome rearrangements (Dickson et al. 2016). These observations are important because there is currently a great deal of interest in manipulating or eliminating Ae. aegypti populations on a global scale (Zhang et al. 2015; Rasic et al. 2014). The presence of cryptic Ae. aegypti species could negatively impact this effort. There is a great need to define the geographic distributions of chromosome rearrangements that are presumably associated with these cryptic Ae. aegypti taxa or subspecies.
Acknowledgments
This work was supported by National Institutes of Health (NIH) R01AI0833680 to WCB4 and a European Research Council (ERC) grant 281668 to F.M.J.
Footnotes
Supplemental material is available online at www.g3journal.org/lookup/suppl/doi:10.1534/g3.116.036053/-/DC1.
Communicating editor: R. Kulathinal
Literature Cited
Author notes
These authors contributed equally to this work.
Present address: Department of Genomes and Genetics, Institut Pasteur – Centre National de la Recherche Scientifique, Unité de Recherche Associée, 3012 Paris, France.
