


Abstract
Genome-wide studies (GWS) of SNP associations and differential gene expressions have generated abundant results; next-generation sequencing technology has further boosted the number of variants and genes identified. Effective interpretation requires massive annotation and downstream analysis of these genome-wide results, a computationally challenging task. We developed the snpGeneSets package to simplify annotation and analysis of GWS results. Our package integrates local copies of knowledge bases for SNPs, genes, and gene sets, and implements wrapper functions in the R language to enable transparent access to low-level databases for efficient annotation of large genomic data. The package contains functions that execute three types of annotations: (1) genomic mapping annotation for SNPs and genes and functional annotation for gene sets; (2) bidirectional mapping between SNPs and genes, and genes and gene sets; and (3) calculation of gene effect measures from SNP associations and performance of gene set enrichment analyses to identify functional pathways. We applied snpGeneSets to type 2 diabetes (T2D) results from the NHGRI genome-wide association study (GWAS) catalog, a Finnish GWAS, and a genome-wide expression study (GWES). These studies demonstrate the usefulness of snpGeneSets for annotating and performing enrichment analysis of GWS results. The package is open-source, free, and can be downloaded at: https://www.umc.edu/biostats_software/.
GWS have generated abundant results in the past decade, with the advent of next-generation sequencing technologies boosting the number of findings. Two common GWS that contribute to these results are the GWAS, which tests phenotype-SNP associations, and the GWES, which examines differential gene expressions (Visscher et al. 2012; Rung and Brazma 2013). Before effectively interpreting GWS results, we must quickly and efficiently perform mass annotations. First, SNPs and genes must be mapped to their genetic positions. Then, all significant SNPs must be mapped to neighboring genes for functional attribution of individual GWAS findings. Lastly, we annotate the coordination of functions across multiple genes based on genetic knowledge bases and identification of functional pathways from the GWS results.
Functionally related genes, known as a gene set or pathway, typically act in concert to perform specific biological tasks influencing disease susceptibility and phenotype variation in the population (Hirschhorn 2009; Subramanian et al. 2005). After the primary analysis, researchers often investigate the genetic pathways enriched in the GWS results; the aim is to detect collective effects from groups of genes with shared biological function that may be obscured in individual tests of variants and genes during GWS (Hirschhorn 2009). These findings may shed light on the underlying biological processes. An integrated package, which allows rapid mapping between SNPs, genes, and gene sets, and implements functional pathway analysis, will play an important role in understanding GWS results and providing insight into the architecture of the disease.
SNP annotations can be extracted from the NCBI SNP database (dbSNP) (Sherry et al. 2001), a central public repository that describes all short genetic variants identified to date. Each SNP is assigned a reference “rs” ID, a widely accepted name that specifies a particular GWAS variant. This database uses the most recent genome build to assign map positions to all variants. However, published GWAS give variant and gene positions based on older genome builds, e.g., NCBI36/hg18. It is challenging to quickly obtain updated annotation for all GWAS SNPs using online dbSNP searches. Efficient access to dbSNP, which enables fast remapping of a massive number of SNPs from the older genome build to the newest one (e.g., GRCh37/hg19 or GRCh38/hg38), is therefore essential for accurate interpretation and downstream analysis of GWAS results.
Gene annotations can be sourced from Entrez Gene, a database that maintains records for genes found in organisms with completely sequenced genomes (Maglott et al. 2011). Every gene is assigned a unique identifier, map position, and official gene symbol approved by the HGNC (Eyre et al. 2006). The NCBI developed a data retrieval system, Entrez, that provides a user-friendly search of genetic annotations from dbSNP and gene databases (Geer and Sayers 2003). The UCSC Genome Browser is another interactive web-based resource that allows access to various types of genetic annotations (Fujita et al. 2011). Unfortunately, these web-based systems prevent the quick retrieval of a large number of annotations in a convenient data format for direct analysis.
Genes are the functional molecular units of genetics; their effects are measured to reveal genetic mechanisms underlying disease. GWES directly measures gene effects by testing differential gene expression associated with disease, whereas GWAS results must be further analyzed to indirectly measure gene effects through SNP associations. Each GWAS can generate over 1 million SNP associations, thus, it is a daunting task to quickly map the huge number of SNPs to genes and compute the gene effects (Peng et al. 2010). Before performing a pathway analysis to identify functionally related genes, a valid gene-based effect measure must be derived from the GWAS results. In addition, a pathway study relies on efficient access to, and analysis of, annotated gene sets from corresponding knowledge bases.
Various knowledge bases provide annotations for different types of gene sets: the Kyoto Encyclopedia of Genes and Genomes (KEGG) (Kanehisa et al. 2010) pathway database presents knowledge on the molecular interaction and reaction networks; the Gene Ontology (GO) (Harris et al. 2004) base uses controlled and structured vocabularies to define genes sets by their molecular functions, biological processes, and cellular components; and the Reactome pathway knowledge base provides molecular details of biological signals and cellular processes (Fabregat et al. 2016). In contrast to these specific knowledge bases, the MSigDB is regarded as a meta knowledge base; it not only generates annotation from publications but also collects gene set annotations from various knowledge bases, including KEGG, GO, and Reactome, through both manual curation and automatic computational means (Liberzon et al. 2011). Exploiting these knowledge bases can help identify functionally related genes for interpreting GWS results and performing downstream analysis (Subramanian et al. 2005; Mei et al. 2015; Hirschhorn 2009). These knowledge bases can be publicly accessed online or downloaded for local use. However, the annotation data are not well organized for direct analysis with GWS results. A software package that seamlessly integrates knowledge bases of gene set annotations for fast and convenient access is critically needed.
A common postanalysis of GWS results is the gene set enrichment study, which aims to identify whether genes from particular pathways are associated with a phenotype. Gene set enrichment analysis (Subramanian et al. 2005) was first developed to investigate pathway enrichment based on gene expression, but the statistical methods were extended to identify functional pathways based on SNP associations from GWAS (Wang et al. 2007). Since enrichment analyses use GWS results and do not require access to participant-level SNP and gene data, they can broaden the use of publicly available GWS results and enhance understanding of the GWS findings. However, the enrichment analysis requires comprehensive genome-wide annotations for SNPs, genes, and gene sets, which is time consuming and computationally burdensome, especially for GWAS results. An efficient software package with integrated flexible annotation has an important role in facilitating post-GWS enrichment analysis.
To facilitate the interpretation of GWS results and follow-up analyses, we developed a software package, snpGeneSets, which provides three main types of annotations: (1) genomic mapping annotation for SNPs and genes, along with functional annotation for gene sets; (2) bidirectional mapping between SNPs and genes, and between genes and gene sets; and (3) derivation of flexible gene effect measures from SNP associations and identification of pathways by enrichment analysis.
Materials and Methods
The snpGeneSets package uses the R platform and the functions summarized in Figure 1 to support the interpretation and postanalysis of GWS results. The package invokes convenient wrapper functions to allow transparent access to the integrated genomic knowledge bases (Figure 1A), assign three main types of annotations (genomic mapping, relation mapping, and deriving gene measures and enrichment tests; Figure 1B), and implement auxiliary functions (Figure 1C) to support the annotations.
Systematic components of the snpGeneSets package. (A) Local genomic knowledge base: it parses the public NCBI dbSNP, Entrez Gene, and MSigDB databases to generate the SNP map (“snpmap”), gene map (“genemap”), gene sets (“geneSets”), and gene information (“geneInfo”) tables. (B) Three main annotations: (1) genomic mapping annotations for SNPs and genes, and functional annotation for gene sets; (2) relation mapping annotations between SNPs and genes, and between genes and gene sets; and (3) analysis-based annotation for measuring genes from SNP associations and testing gene set enrichment. (C) Auxiliary functions: they aim to support the first two major components (A and B), including identification of SNPs and genes from a defined genomic region, retrieval of genes and gene sets from a particular gene set category, permutation test and p-value calculations for gene set enrichment for genes, computation of the U-score for genes, and creation of a gene set database. MSigDB, Molecular Signatures Database; NCBI, National Center for Biotechnology Information; SNP, single nucleotide polymorphism.
Genomic knowledge bases
The knowledge bases are locally integrated into the snpGeneSets package and are built by parsing the online NCBI dbSNP (Sherry et al. 2001), Entrez Gene (Maglott et al. 2011), and MSigDB gene set (Liberzon et al. 2011) databases. The knowledge bases contain two tables titled “snpmaps” and “genemaps” for SNP and gene map annotations, respectively, based on the two most recent genome builds (GRCh37/hg19 and GRCh38/hg38). The SNP annotation includes all common variants and uncommon variants identified by the 1000 Genomes project. The gene annotation includes map positions of transcription start sites (TSS) and termination sites (TTS).
The genomic knowledge bases parse the MSigDB V4.0 gene sets to generate tables named “geneSets” and “geneInfo” (Figure 1A). The “geneSets” table provides annotation for every MSigDB gene set, including pathway name, link to the web site, functionally related component genes, and the size. Each gene set is assigned a unique snpGeneSets pathway ID (PID) to facilitate access. Gene sets are classified into different categories based on the methods or data sources that generate the annotation, e.g., KEGG (Kanehisa et al. 2012), GO (Harris et al. 2004), or Reactome (Croft et al. 2014). In contrast to “geneSets,” the “geneInfo” table provides annotations for component genes instead of the gene set. The “geneInfo” table contains the Entrez gene ID, official gene symbol, the corresponding gene set, and the category.
The local genomic knowledge bases leverage the SQLite database management system. The snpGeneSets package integrates these knowledge bases and employs wrapper functions to permit transparent and seamless access to low-level databases and a large amount of genomic annotation using a simplified query. This package facilitates massive data integration while also being self-contained, serverless, maintenance-free, and platform-independent (with zero-configuration).
Main annotations
Genomic mapping is the first type of annotation for SNPs, genes, and gene sets. The package includes the functions getSNPMap() and getGeneMap() to retrieve genomic mapping positions for a large amount of SNPs and genes, respectively (Figure 1B). The getGeneSetInfo() function returns the annotation for gene sets and component genes.
Relation mapping is the second type of annotation provided by snpGeneSets; its purpose is to identify bidirectional mapping relations between SNPs, genes, and gene sets (Figure 1B). Specifically, the function snp2Gene() simultaneously maps all genome-wide SNPs to genes based on flexibly defined gene boundaries, while the gene2snp() performs the reverse relation mapping and finds all annotated SNPs for one or more genes. The gene2Set() function identifies all gene sets that contain a particular gene and the set2gene() function does the reverse mapping to get all genes belonging to a particular gene set.
The third main component of snpGeneSets is the analysis-based annotation that reveals functional genetic pathways from GWS results (Figure 1B). This analysis is gene-centric, with the pathway identification dependent on the type of gene effect measure. The getGeneMeasure() function computes four gene effect measures from GWAS SNP associations (Table 1): (1) the minP method exploits the minimum p-value among SNPs in a gene as the measure of the gene effect; (2) the 2ndP method selects the second strongest p-value as the gene measure (2ndP) [compared to the strongest SNP association in a gene, the second most strongly associated SNP is less likely to be influenced by outliers (Nam et al. 2010)]; (3) the simP method computes the Simes’ p-value to measure the gene effect using all SNP associations and an adjustment for the number of SNPs in the gene; and (4) the fishP method measures the gene effect by summarizing all SNP associations in a gene.
Gene effect measures computed from the SNP association p-values
| Method | Gene Measure | Description |
|---|---|---|
| minP | P = p(1) | The minimum p-value among SNPs in the gene |
| 2ndP | P = p(2) | The second smallest p-value of SNPs in the gene |
| simP | P = mini{K∙p(i)/i} | Simes’ p-value adjusted for the number of SNPs |
| fishP | Fisher’s combined p-value |
p1, p2, …, pk: the association p-values of K SNPs located in the same gene; p(1)≤ p(2)≤ … ≤ p(k): the ordered association p-values of the K SNPs. a random variable that follows a chi-square distribution with 2 k degrees of freedom. SNP, single nucleotide polymorphism.
| Method | Gene Measure | Description |
|---|---|---|
| minP | P = p(1) | The minimum p-value among SNPs in the gene |
| 2ndP | P = p(2) | The second smallest p-value of SNPs in the gene |
| simP | P = mini{K∙p(i)/i} | Simes’ p-value adjusted for the number of SNPs |
| fishP | Fisher’s combined p-value |
p1, p2, …, pk: the association p-values of K SNPs located in the same gene; p(1)≤ p(2)≤ … ≤ p(k): the ordered association p-values of the K SNPs. a random variable that follows a chi-square distribution with 2 k degrees of freedom. SNP, single nucleotide polymorphism.
For GWES and other gene-based tests, snpGeneSets directly uses the gene expression p-value as the gene effect measure. To facilitate the interpretation and analysis, the snpGeneSets package converts GWS gene measures to uniform-scores (U-scores). Suppose Mi is the gene measure for the i-th gene and L is the total number of genes. The U-score of the i-th gene is calculated as The U-score approximately follows a uniform distribution; the value estimates the percentage of genes with stronger effects than the examined gene.
In contrast to the mapping relations between genes and gene sets, the enrichment analysis identifies pathways enriched for genes with high ranked measures. The snpGeneSets package conducts two types of enrichment tests: (1) the candidate gene enrichment analysis (CGEA) compares candidate genes to all genes annotated in the knowledge base; (2) the uniform-score gene set analysis (USGSA) compares genes with U-scores meeting a criterion to all GWS genes. Both analyses apply a hypergeometric exact test to estimate the enrichment effects and obtain p-values directly from the distribution function. The enrichment test can be limited to a specific gene set category, e.g., KEGG. The alternative (H1) hypotheses, parameter definitions, effect estimates, standard errors, and exact pathway p-values (pe) for the two tests are defined in Table 2. The enrichTest1() and enrichTest2() functions perform the CGEA (type 1) and USGSA (type 2) tests, respectively (Figure 1B).
Two types of gene set enrichment tests
| Type 1 Test (CGEA) | Type 2 Test (USGSA) | |
|---|---|---|
| H1 hypothesis | Candidate genes (Φ) are enriched in the tested gene set (Ω) of a particular category (e.g., KEGG) | GWS genes with high ranked U-scores are enriched in the tested gene set (Ω) of a particular category (e.g., KEGG) |
| Parameters | L: the number of genes (Gi: 1 ≤ i ≤ L) in the gene set category (e.g., KEGG). | L: the number of GWS genes (Gi: 1 ≤ i ≤ L) |
| the number of candidate genes | the number of genes with U-scores in the top α (α = 5% in default) | |
| the gene set size | the gene set size | |
| the number of genes in the gene set overlapping candidate genes | the number of genes in the gene set with U-scores in the top α (α = 5% in default) | |
| Effect | K/S-l/L | K/S-l/L |
| SE | ||
| Exact p-value | ||
| R function | enrichTest1() | enrichTest2() |
CGEA, candidate gene enrichment analysis; USGSA, uniform-score gene set analysis; KEGG, Kyoto Encyclopedia of Genes and Genomes; GWS, genome-wide study.
| Type 1 Test (CGEA) | Type 2 Test (USGSA) | |
|---|---|---|
| H1 hypothesis | Candidate genes (Φ) are enriched in the tested gene set (Ω) of a particular category (e.g., KEGG) | GWS genes with high ranked U-scores are enriched in the tested gene set (Ω) of a particular category (e.g., KEGG) |
| Parameters | L: the number of genes (Gi: 1 ≤ i ≤ L) in the gene set category (e.g., KEGG). | L: the number of GWS genes (Gi: 1 ≤ i ≤ L) |
| the number of candidate genes | the number of genes with U-scores in the top α (α = 5% in default) | |
| the gene set size | the gene set size | |
| the number of genes in the gene set overlapping candidate genes | the number of genes in the gene set with U-scores in the top α (α = 5% in default) | |
| Effect | K/S-l/L | K/S-l/L |
| SE | ||
| Exact p-value | ||
| R function | enrichTest1() | enrichTest2() |
CGEA, candidate gene enrichment analysis; USGSA, uniform-score gene set analysis; KEGG, Kyoto Encyclopedia of Genes and Genomes; GWS, genome-wide study.
Auxiliary functions
The snpGeneSets package also implements auxiliary functions to support the main annotations, local database creation, and enrichment analysis (Figure 1C). All the SNPs and genes located in a flexibly defined genomic region can be identified using the getRegionSNP() and getRegionGene() functions, respectively. Gene sets in the knowledge base are classified into different categories; the annotation for a particular category can be obtained using the getSetType() function. Mapping relations from a category to genes and gene sets can be characterized through the getSetGenes() and setType2setID() functions, respectively. These mappings, combined with the main annotations, can be applied to perform the enrichment test of a particular category, e.g., KEGG.
Permutation tests, achieved through the functions enrichTest1_Perm() and enrichTest2_Perm(), obtain adjusted p-values for each pathway To facilitate the fast calculation of adjusted p-values, a distribution table for was pregenerated based on 10,000 permutations for the USGSA (type 2) test. Thus, the getEnrich2P() function can generate permutation p-values instantly. Other auxiliary functions for annotation and postanalysis include msigdb_build() for building a local knowledge base of gene sets from MSigDB, uscore() for calculating genome-wide U-scores from gene effect measures, and aligator() for enrichment analysis of GWAS by the ALIGATOR method (Holmans et al. 2009).
Data availability
The snpGeneSets package can be freely downloaded at https://www.umc.edu/biostats_software/. The GWAS catalog is available at https://www.ebi.ac.uk/gwas/. The T2D-GWAS result file supporting the annotation study of this article is available in the NCBI dbGaP under the accession number pha002839 (http://www.ncbi.nlm.nih.gov/projects/SNP/gViewer/gView.cgi?aid=2839). The T2D-GWES data can be identified at the NCBI GEO database with accession number of GDS3782 (http://www.ncbi.nlm.nih.gov/sites/GDSbrowser/?acc=GDS3782). The T2D-GWAS and T2D-GWES data can also be found at the snpGeneSets package.
Results and Discussion
To demonstrate the usefulness of snpGeneSets (version 1.12), we conducted annotation studies using GWS for T2D. We presented three applications using the NHGRI GWAS catalog, a Finnish GWAS, and a GEO GWES. These examples were performed on a Dell Latitude E6338 laptop equipped with a 2.90 GHz CPU (i7-3520M), 16.0 GB RAM memory, and a 64-bit Windows 7 Enterprise operating system.
Genomic knowledge bases
The integrated local copies of annotation for SNPs, genes, and gene sets drive the expediency of the snpGeneSets package. The local knowledge bases contain mapping annotations for: 39,980,570 SNPs mapped to GRCh37 (both common variants with unique genomic positions from dbSNP and uncommon variants from the 1000 Genomes project); 14,270,004 common SNPs mapped to unique genomic positions in GRCh38; 39,814 and 41,409 gene transcripts mapped to GRCh37 and GRCh38, respectively; and 10,295 MSigDB gene sets composed of 32,364 genes classified into 20 categories.
Annotation study of the NHGRI GWAS catalog for T2D
The NHGRI GWAS catalog provides a manually curated collection of published SNP-trait associations with p-values < 10−5 (Welter et al. 2014). We performed an annotation analysis of all T2D SNP associations included in the GWAS catalog (version updated 05/08/2016). We searched the trait “type 2 diabetes” and identified 349 SNP associations with p-values ranging from [8E−75, 9E−06]; these associations represented 225 unique SNPs (Supplemental Material, Table S1). Using genome builds GRCh37 and GRCh38, snpGeneSets obtained positions for all SNPs in < 1 sec.
We mapped the T2D-associated SNPs to genes using build GRCh37 and boundaries 2 kb upstream of the TSS and 2 kb downstream of the TTE (Table S2); we identified 106 T2D genes from 134 unique SNPs. The snpGeneSets annotation (e.g., SNP position, mapped gene official symbol, Entrez gene ID, and gene location) was compared to the gene information described in the original publication. For example, SNP rs6712932 (PMID = 17668382) was reported as an intergenic variant but our annotation mapped it to GPR45; SNP rs13424957 (PMID = 21347282) was reported as intergenic but mapped to a noncoding RNA gene (LOC101929633); rs12304921 had no reported gene in published GWAS (PMID = 17554300) but mapped to HIGD1C; and rs10190052 was located in TMEM18 in the original publication (PMID = 24509480) but failed to map to any gene using our annotation (Table S1). In addition, snpGeneSets allows users to flexibly define gene boundaries for SNP-to-gene mapping.
We further performed CGEA (type 1) enrichment tests to identify pathways overrepresented by the T2D-mapped genes from the GWAS catalog. This analysis was limited to the KEGG category of gene sets and the 106 unique mapped genes which were inputted to the enrichTest1() function. The results are shown in Table S3. Of the 5267 genes included in the KEGG gene sets, 27 were T2D genes from the GWAS catalog. “Maturity onset diabetes of the young” with PID = 2866 (KEGG, http://www.genome.jp/dbget-bin/www_bget?hsa04950) was the only significant pathway with respective unadjusted and adjusted p-values of 6.44E−06 and 0 based on 1000 permutations (Table S3). The enrichment effect estimate suggested that T2D-mapped genes had a 15.49% higher probability of clustering in this pathway than random genes. This pathway is related to the monogenic form of T2D and contains 25 genes, including four T2D-mapped genes (GCK, HNF4A, HNF1A, and HNF1B). Map annotations of the four genes using both genome builds (GRCh37 and GRCh38) are summarized in Table 3. HNF4A, HNF1A, and HNF1B encode transcription factors required for regulating the expression of several hepatic genes, while GCK encodes the enzyme glucokinase involved in the phosphorylation of glucose.
Genomic mapping annotation for T2D genes from the GWAS catalog
| Gene_ID | Gene_name | Full_name | Chr. | Start1 (bp) | End1 (bp) | Start2 (bp) | End2 (bp) | Strand |
|---|---|---|---|---|---|---|---|---|
| 2645 | GCK | Glucokinase | 7 | 44,183,870 | 44,229,022 | 44,144,271 | 44,189,423 | — |
| 3172 | HNF4A | Hepatocyte nuclear factor 4 α | 20 | 42,984,441 | 43,061,485 | 44,355,801 | 44,432,845 | + |
| 6927 | HNF1A | HNF1 homeobox A | 12 | 121,415,861 | 121,440,315 | 120,978,058 | 121,002,512 | + |
| 6928 | HNF1B | HNF1 homeobox B | 17 | 36,046,434 | 36,105,096 | 37,686,431 | 37,745,105 | — |
“Start1” and “End1”, gene transcript start and end position based on GRCh37. “Start2” and “End2”, gene transcript start and end position based on GRCh38. Chr., chromosome.
| Gene_ID | Gene_name | Full_name | Chr. | Start1 (bp) | End1 (bp) | Start2 (bp) | End2 (bp) | Strand |
|---|---|---|---|---|---|---|---|---|
| 2645 | GCK | Glucokinase | 7 | 44,183,870 | 44,229,022 | 44,144,271 | 44,189,423 | — |
| 3172 | HNF4A | Hepatocyte nuclear factor 4 α | 20 | 42,984,441 | 43,061,485 | 44,355,801 | 44,432,845 | + |
| 6927 | HNF1A | HNF1 homeobox A | 12 | 121,415,861 | 121,440,315 | 120,978,058 | 121,002,512 | + |
| 6928 | HNF1B | HNF1 homeobox B | 17 | 36,046,434 | 36,105,096 | 37,686,431 | 37,745,105 | — |
“Start1” and “End1”, gene transcript start and end position based on GRCh37. “Start2” and “End2”, gene transcript start and end position based on GRCh38. Chr., chromosome.
Annotation study of the T2D-GWAS
Results of the T2D-GWAS can be accessed from the NIH dbGaP database utilizing accession ID pha002839 (Scott et al. 2007; Tryka et al. 2014). This GWAS consisted of 1161 Finnish T2D cases and 1174 Finnish glucose-tolerant controls genotyped on the Illumina HumanHap300 BeadChip. SNP associations with T2D were tested by logistic regression under the additive genetic model. The GWAS results included 306,368 genotyped SNPs and a minimum p-value of 2.38E−06 at rs886374. There were 3 and 41 SNPs with p-values ≤ 1E−05 and 1E−04, respectively, and 0.1, 1.1, and 5.3% of SNPs with p-values ≤ 0.001, 0.01, and 0.05, respectively. We applied snpGeneSets to obtain SNP map annotation from the updated genome build. Annotation was provided for 306,252 SNPs from GRCh37/hg19 and 306,045 SNPs from GRCh38/hg38 in about 6 sec. The map annotation allowed quick access to accurate positions for all T2D-GWAS SNPs and identification of nearby genes for inferring SNP function.
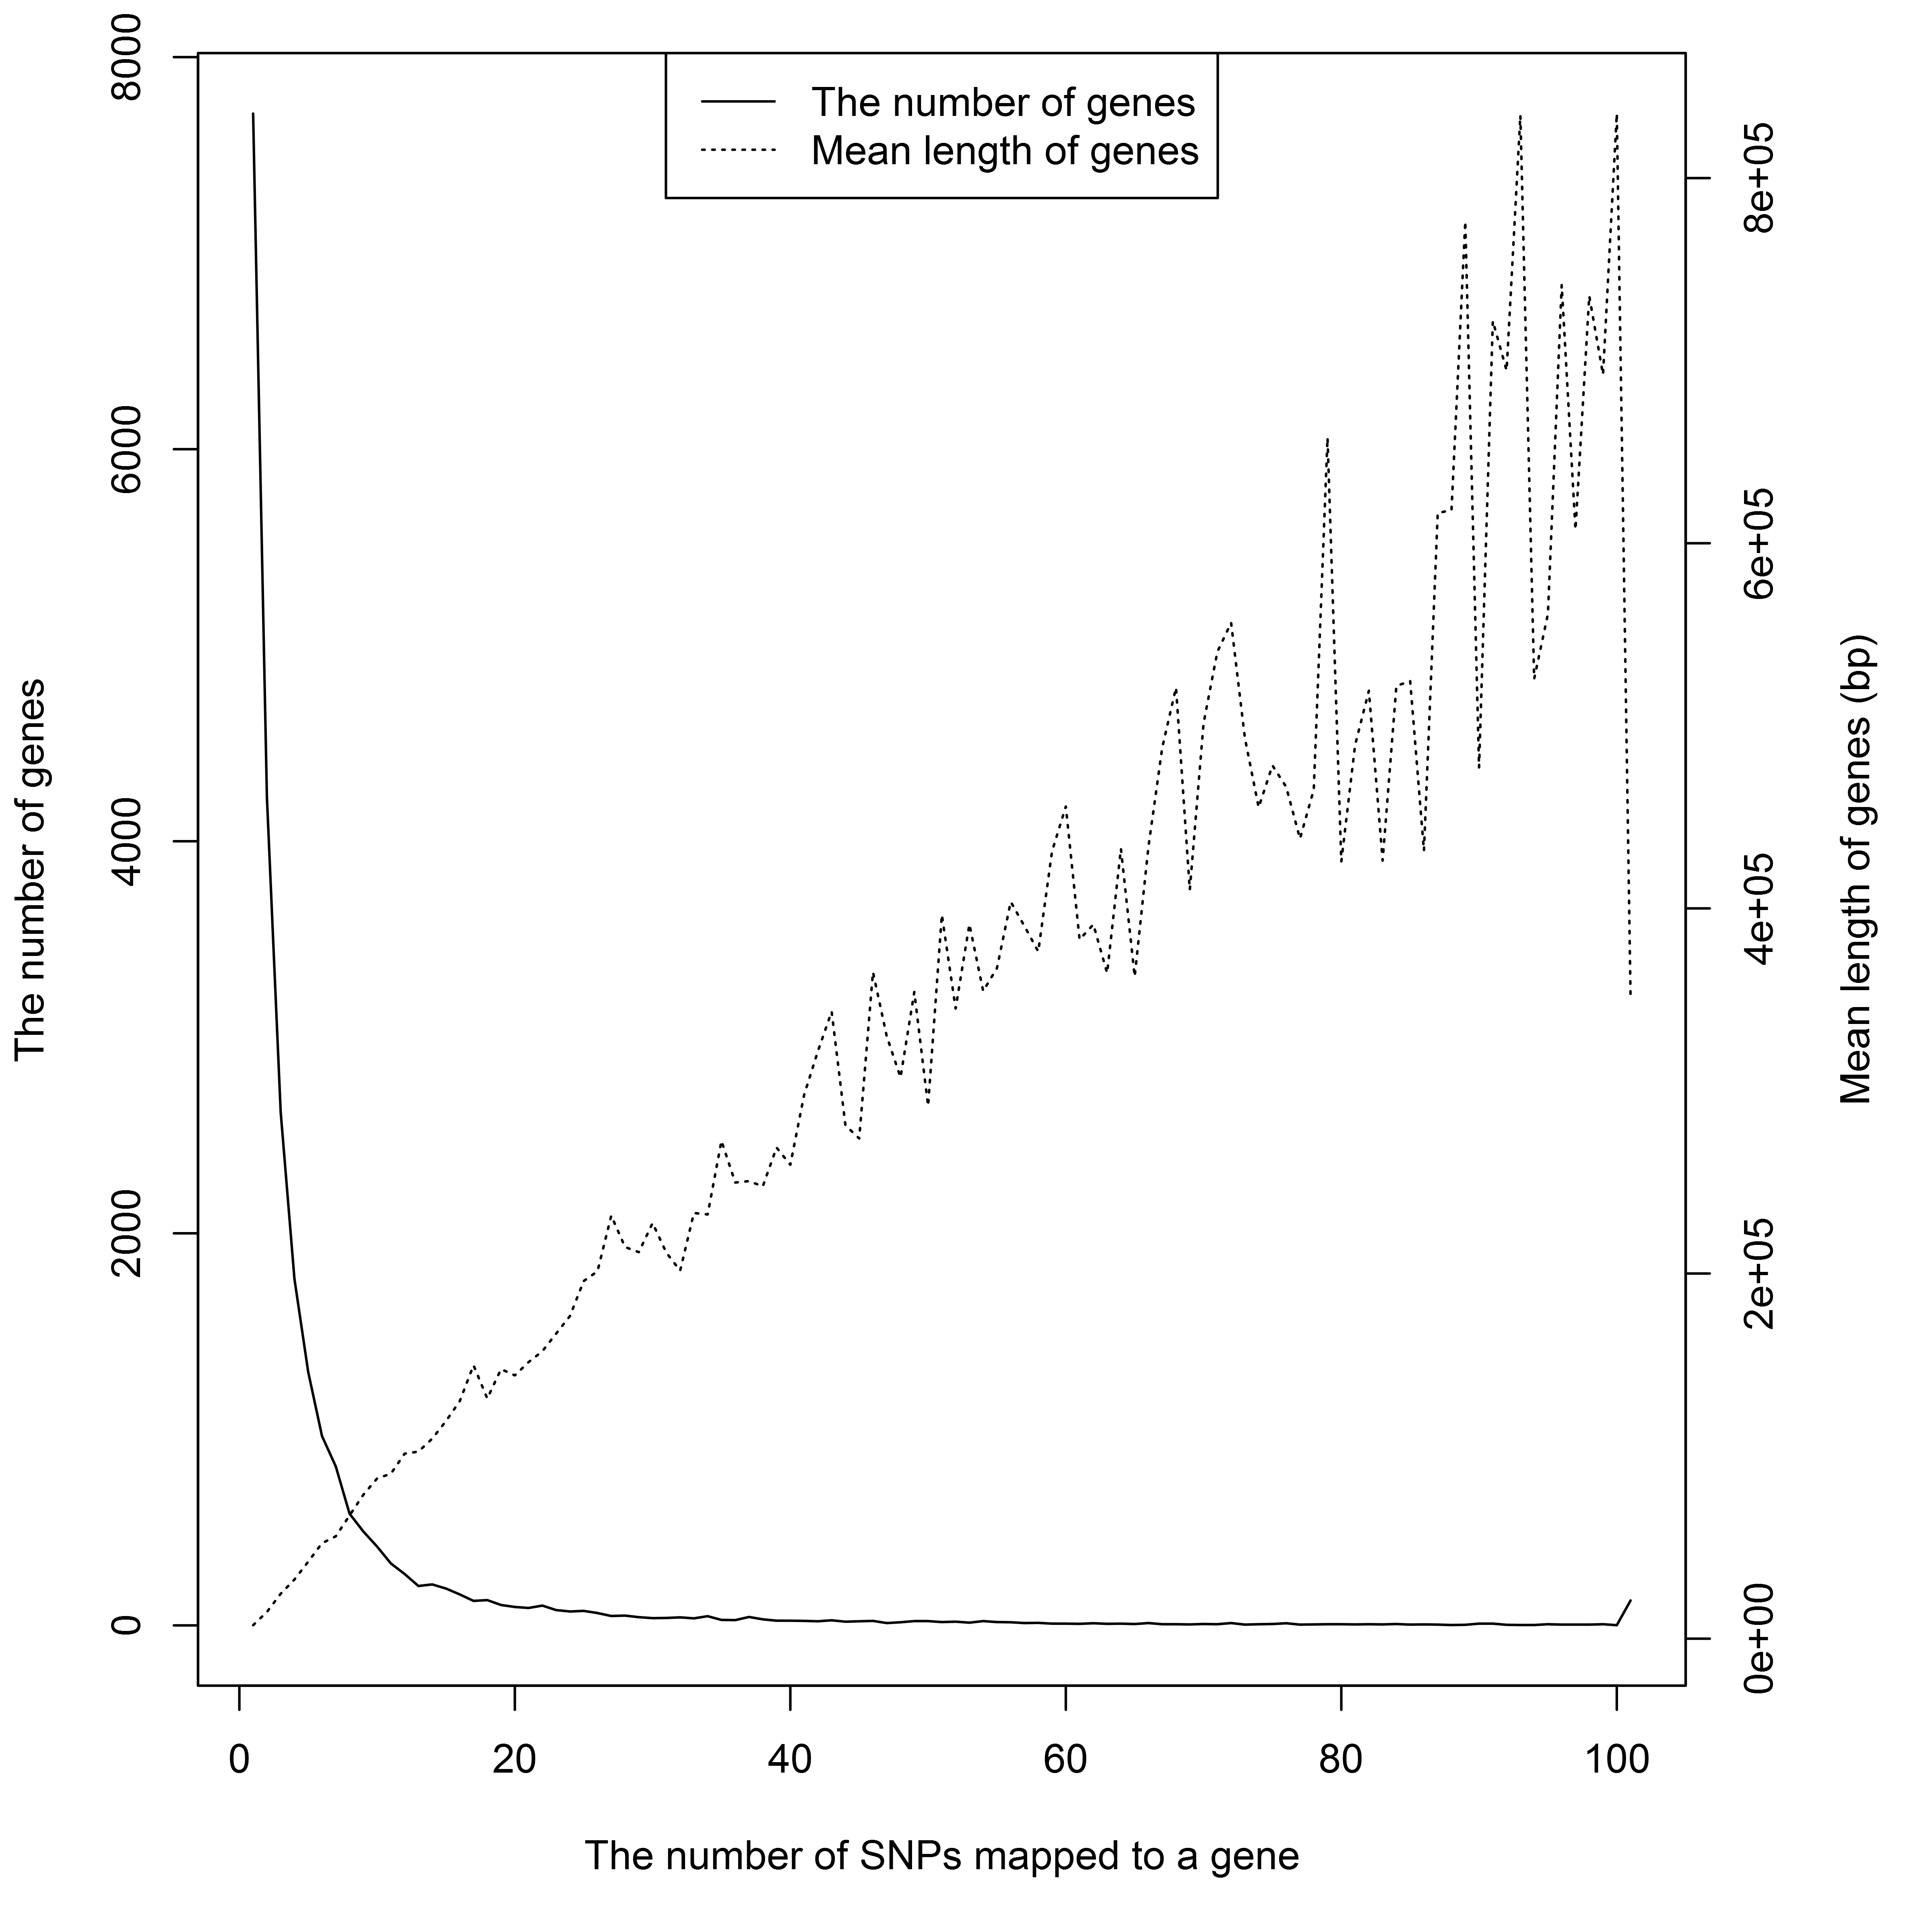
Genomic mapping from SNPs to genes is the second type of annotation. We defined the gene boundaries as 2 kb upstream of the gene TSS and 2 kb downstream of the gene TTS. Using build GRCh37, the snp2Gene() function mapped 172,041 SNPs to 24,339 genes in about 10 min. 32% of mapped genes contained only one GWAS SNP. The number of genes and gene-mapped SNPs have a negative association; genes with more mapped SNPs tend to be bigger in size (Figure S1). The best SNP, rs886374, mapped to SORCS2.
Measures and U-scores of gene effects were computed from SNP associations. The minP, 2ndP, and fishP measures identified SORCS2, TCF7L2, and LMO7 as the strongest genes, respectively; the simP measure identified microRNA genes, MIR127, MIR136, MIR433, and MIR432, as the strongest (Table 4). The distribution of the gene measure p was estimated by the percentage of genes with p ≤ α [i.e., Pr (P ≤ α)]. The empirical cumulative distribution of different measures and the expected uniform distribution were plotted in Figure 2. The rank order for the best approximation of the uniform distribution is the simP, fishP, 2ndP, and minP measure. The estimated Pr (P ≤ α) for α = 0.01/0.05/0.10 was 0.01/0.05/0.10, 0.04/0.09/0.14, 0.02/0.09/0.17, and 0.05/0.17/0.28 for the simP, fishP, 2ndP, and minP measures, respectively. This demonstrated that gene identification depends on the gene effect measure used and different measures are not comparable due to heterogeneous distributions. In contrast, the U-score transforms all gene effect measures into uniform distributions and makes different measures comparable and interpretable on the same scale. We plotted the four measures and U-scores for the T2D-mapped genes (GCK, HNF4A, HNF1A, and HNF1B) from the GWAS catalog in Figure 3. GCK and HNF4A consistently ranked in the top 5% of all identified genes in the T2D-GWAS data. The respective U-score values corresponding to the minP, 2ndP, simP, and fishP measures were 0.0089, 0.0048, 0.0127, and 0.0098 for GCK and 0.034, 0.012, 0.050, and 0.017 for HNF4A.
The strongest gene effects identified in the Finnish T2D-GWAS
| Method | Gene Measure | Gene_ID | Gene_name | Chr. | Strand | Start1 (bp) | End1 (bp) | Start2 (bp) | End2 (bp) |
|---|---|---|---|---|---|---|---|---|---|
| minP | 2.38E−06 | 57537 | SORCS2 | 4 | + | 71,94,374 | 7,744,564 | 7,192,647 | 7,742,837 |
| 2ndP | 1.51E−05 | 6934 | TCF7L2 | 10 | + | 114,709,978 | 114,927,437 | 112,950,219 | 113,167,678 |
| simP | 3.69E−05 | 406914 | MIR127 | 14 | + | 101,349,316 | 101,349,412 | 100,882,979 | 100,883,075 |
| 406927 | MIR136 | 14 | + | 101,351,039 | 101,351,120 | 100,884,702 | 100,884,783 | ||
| 574034 | MIR433 | 14 | + | 101,348,223 | 101,348,315 | 100,881,886 | 100,881,978 | ||
| 574451 | MIR432 | 14 | + | 101,350,820 | 101,350,913 | 100,884,483 | 100,884,576 | ||
| fishP | 7.09E−17 | 4008 | LMO7 | 13 | + | 76,194,570 | 76,434,006 | 75,620,434 | 75,859,870 |
“Start1” and “End1”, gene transcript start and end position based on GRCh37. “Start2” and “End2”, gene transcript start and end position based on GRCh38. Chr., chromosome.
| Method | Gene Measure | Gene_ID | Gene_name | Chr. | Strand | Start1 (bp) | End1 (bp) | Start2 (bp) | End2 (bp) |
|---|---|---|---|---|---|---|---|---|---|
| minP | 2.38E−06 | 57537 | SORCS2 | 4 | + | 71,94,374 | 7,744,564 | 7,192,647 | 7,742,837 |
| 2ndP | 1.51E−05 | 6934 | TCF7L2 | 10 | + | 114,709,978 | 114,927,437 | 112,950,219 | 113,167,678 |
| simP | 3.69E−05 | 406914 | MIR127 | 14 | + | 101,349,316 | 101,349,412 | 100,882,979 | 100,883,075 |
| 406927 | MIR136 | 14 | + | 101,351,039 | 101,351,120 | 100,884,702 | 100,884,783 | ||
| 574034 | MIR433 | 14 | + | 101,348,223 | 101,348,315 | 100,881,886 | 100,881,978 | ||
| 574451 | MIR432 | 14 | + | 101,350,820 | 101,350,913 | 100,884,483 | 100,884,576 | ||
| fishP | 7.09E−17 | 4008 | LMO7 | 13 | + | 76,194,570 | 76,434,006 | 75,620,434 | 75,859,870 |
“Start1” and “End1”, gene transcript start and end position based on GRCh37. “Start2” and “End2”, gene transcript start and end position based on GRCh38. Chr., chromosome.
Q-Q plot of the gene effect measures. The observed sample quantiles of the minP, 2ndP, simP, and fishP gene measures against the theoretical quantiles of the uniform distribution.
Gene measures and U-scores for GCK, HNF4A, HNF1A, and HNF1B using the type 2 diabetes genome-wide association study. The gene measure values and transformed U-scores for all four genes using (A) minP, (B) 2ndP, (C) simP, and (D) fishP.
We measured the effects of 102 T2D-mapped genes from the GWAS catalog in the T2D-GWAS data. FishP, minP, 2ndP, and simP, respectively, identified 27.45, 19.61, 17.65, and 9.80% of genes with U-scores ≤ 0.05, which exceeded the expected percentage (5%) with p-values of 9.58E−07, 1.77E−04, 5.99E−04, and 0.054. Similar results were observed for U-scores ≤ 0.10, for which fishP, minP, 2ndP, and simP, respectively identified 41.18, 32.35, 36.27, and 15.69% of the genes; the corresponding p-values for exceeding the expected percentage (10%) were 2.88E−09, 2.73E−06, 1.49E−07, and 0.060. The detailed results are shown in Table 5. Our analysis indicated that T2D-mapped genes from the GWAS catalog tended to have higher effect measures than random genes.
Test of T2D-mapped genes from the GWAS catalog in the T2D-GWAS and T2D-GWES data
| Data | N | Gene Measure | Mean1 | Stat1 | P1 | Mean2 | Stat2 | P2 |
|---|---|---|---|---|---|---|---|---|
| T2D-GWAS | 102 | minP | 19.61% | 3.70 | 1.77E−04 | 32.35% | 4.80 | 2.73E−06 |
| T2D-GWAS | 102 | 2ndP | 17.65% | 3.33 | 5.99E−04 | 36.27% | 5.49 | 1.49E−07 |
| T2D-GWAS | 102 | simP | 9.80% | 1.62 | 0.054 | 15.69% | 1.57 | 0.060 |
| T2D-GWAS | 102 | fishP | 27.45% | 5.06 | 9.58E−07 | 41.18% | 6.37 | 2.88E−09 |
| T2D-GWES | 86 | p-value | 12.79% | 2.15 | 0.017 | 22.09% | 2.69 | 0.004 |
N, the number of T2D-mapped genes from the GWAS catalog that were measured in the T2D-GWAS or T2D-GWES data; Mean1, percent of genes with U-scores ≤ 0.05; Stat1 and P1, the t statistic and p-value for testing Mean1 > 5%; Mean2, percent of genes with U-scores ≤ 0.10; Stat2 and P2, the t statistic and p-value for testing Mean2 > 10%. T2D, type 2 diabetes; GWAS, genome-wide association study; GWES, genome-wide expression study.
| Data | N | Gene Measure | Mean1 | Stat1 | P1 | Mean2 | Stat2 | P2 |
|---|---|---|---|---|---|---|---|---|
| T2D-GWAS | 102 | minP | 19.61% | 3.70 | 1.77E−04 | 32.35% | 4.80 | 2.73E−06 |
| T2D-GWAS | 102 | 2ndP | 17.65% | 3.33 | 5.99E−04 | 36.27% | 5.49 | 1.49E−07 |
| T2D-GWAS | 102 | simP | 9.80% | 1.62 | 0.054 | 15.69% | 1.57 | 0.060 |
| T2D-GWAS | 102 | fishP | 27.45% | 5.06 | 9.58E−07 | 41.18% | 6.37 | 2.88E−09 |
| T2D-GWES | 86 | p-value | 12.79% | 2.15 | 0.017 | 22.09% | 2.69 | 0.004 |
N, the number of T2D-mapped genes from the GWAS catalog that were measured in the T2D-GWAS or T2D-GWES data; Mean1, percent of genes with U-scores ≤ 0.05; Stat1 and P1, the t statistic and p-value for testing Mean1 > 5%; Mean2, percent of genes with U-scores ≤ 0.10; Stat2 and P2, the t statistic and p-value for testing Mean2 > 10%. T2D, type 2 diabetes; GWAS, genome-wide association study; GWES, genome-wide expression study.
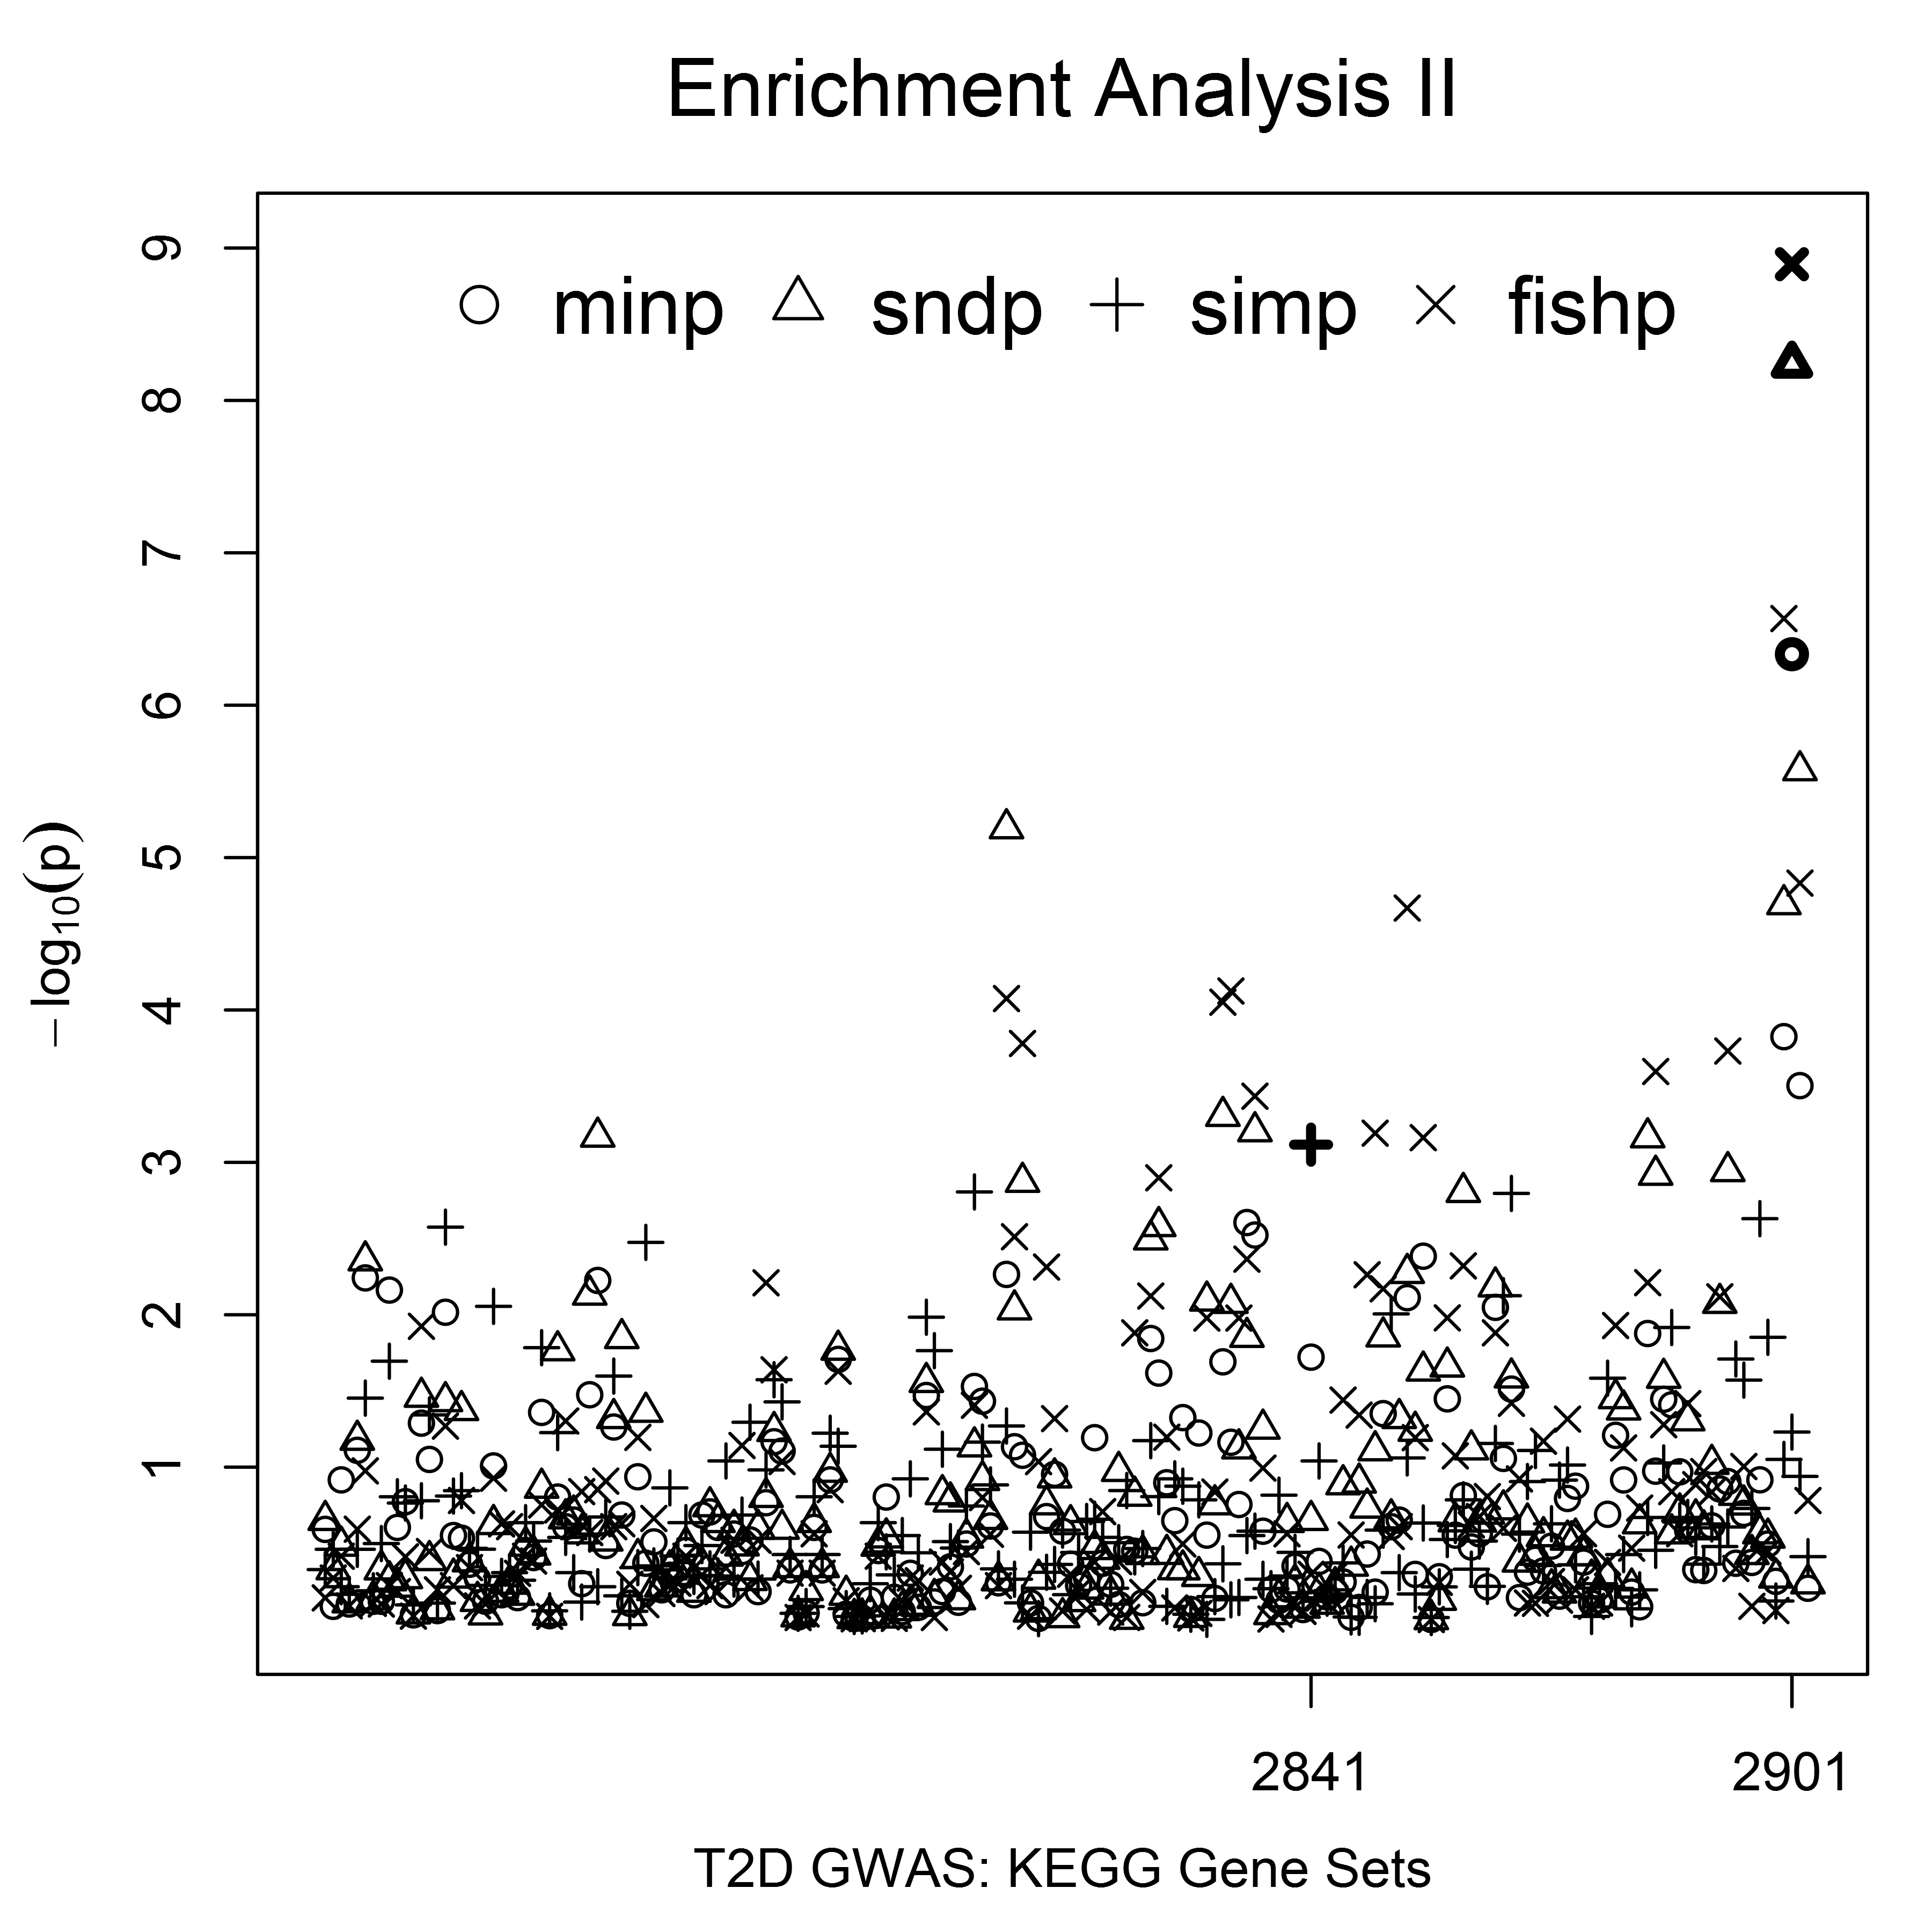
The four microRNA genes identified by the simP measure were absent from the KEGG category. However, the mapping relation annotation showed that LMO7 and TCF7L2 (identified by the fishP and 2ndP gene measures, respectively) belong to the KEGG pathway “cell-cell adherens junctions” associated with diabetes (KEGG, http://www.genome.jp/dbget-bin/www_bget?hsa04520). In contrast to the mapping relation annotation, the enrichment analysis maps a set of genes to enriched pathways. The USGSA (type 2) test implemented by the enrichTest2() function examines enrichment of annotated pathways using genes with U-scores ≤ α. The T2D-GWAS enrichment analysis was performed on the KEGG category with α = 0.05, testing KEGG pathways enriched for genes with effect measures ranking in the top 5%. The negative logarithm of each pathway was shown in the Figure S2 and the enrichment results for the strongest pathway are summarized in Table 6. The minP, 2ndP, and fishP measures consistently showed that “Arrhythmogenic right ventricular cardiomyopathy” with PID = 2901 (KEGG, http://www.genome.jp/dbget-bin/www_bget?hsa05412) was the strongest KEGG pathway with: enrichment effects of 17.8, 21.0, and 23.1%, respectively; unadjusted p-values () ≤ 4.63E−07; adjusted p-values (p_table) ≤ 0.0003 based on the pregenerated distribution table; and adjusted p-values (p_perm) = 0 based on 1000 permutation tests. The simP measure identified “RIG-I-like receptor signaling pathway” with PID = 2841 (KEGG, http://www.genome.jp/dbget-bin/www_bget?hsa04622) as the strongest pathway with an enrichment effect of 10.9% and pe of 7.65E−04, but the adjusted p-value was > 0.05 (p_table = 0.26, p_perm = 0.31). Our results showed that the USGSA (type 2) test depends on the α value and the gene effect measure used to summarize SNP associations.
The strongest KEGG pathway identified by the USGSA (type 2) enrichment analysis of the Finnish T2D-GWAS
| Measure | Genes | PID | Size | SetGenes | Effect (%) | SE (%) | pe | p_perm | p_table |
|---|---|---|---|---|---|---|---|---|---|
| minp | 289 | 2901 | 69 | 17 | 17.8 | 3.0 | 4.63E−07 | 0 | 0.0003 |
| 2ndp | 274 | 2901 | 69 | 19 | 21.0 | 3.0 | 5.80E−09 | 0 | 0 |
| simp | 214 | 2841 | 50 | 8 | 10.9 | 3.1 | 7.65E−04 | 0.31 | 0.26 |
| fishp | 309 | 2901 | 69 | 21 | 23.1 | 3.1 | 1.28E−09 | 0 | 0 |
Genes: the number of GWAS genes with U-score ≤ 0.05 used for the enrichment analysis; PID, the pathway ID; “Size, the number of GWAS genes belonging to a Kyoto Encyclopedia of Genes and Genomes (KEGG) pathway; SetGenes, the number of GWAS genes belonging to a KEGG pathway with U-score ≤ 0.05; pe, unadjusted p-value; p_perm, the adjusted p-value based on 1000 permutations; p_table, the adjusted p-value based on the pregenerated distribution table. GWAS, genome-wide association study; GWES, genome-wide expression study.
| Measure | Genes | PID | Size | SetGenes | Effect (%) | SE (%) | pe | p_perm | p_table |
|---|---|---|---|---|---|---|---|---|---|
| minp | 289 | 2901 | 69 | 17 | 17.8 | 3.0 | 4.63E−07 | 0 | 0.0003 |
| 2ndp | 274 | 2901 | 69 | 19 | 21.0 | 3.0 | 5.80E−09 | 0 | 0 |
| simp | 214 | 2841 | 50 | 8 | 10.9 | 3.1 | 7.65E−04 | 0.31 | 0.26 |
| fishp | 309 | 2901 | 69 | 21 | 23.1 | 3.1 | 1.28E−09 | 0 | 0 |
Genes: the number of GWAS genes with U-score ≤ 0.05 used for the enrichment analysis; PID, the pathway ID; “Size, the number of GWAS genes belonging to a Kyoto Encyclopedia of Genes and Genomes (KEGG) pathway; SetGenes, the number of GWAS genes belonging to a KEGG pathway with U-score ≤ 0.05; pe, unadjusted p-value; p_perm, the adjusted p-value based on 1000 permutations; p_table, the adjusted p-value based on the pregenerated distribution table. GWAS, genome-wide association study; GWES, genome-wide expression study.
Annotation study of the T2D-GWES
The T2D-GWES data can be obtained from the GEO database (Accession ID: GDS3782) (Marselli et al. 2010; Barrett et al. 2011). This study assayed the abundance of gene transcripts in the pancreas using 10 control and 10 T2D human subjects (Marselli et al. 2010). In < 1 sec, the genomic mapping annotation identified map positions for 19,299 and 19,283 genes from GRCh37 and GRCh38, respectively. We tested the differential expression of each gene in T2D cases vs. controls through linear models and empirical Bayes methods implemented in the Limma package (Smyth 2004). The T2D-GWES results are integrated into the snpGeneSets package and can be accessed using the load(T2DGWES) function in R.
We directly measured the gene effects using the differential expression p-values and computed the U-scores by the auxiliary function uscore(). Of the T2D-mapped genes from the GWAS catalog, 86 genes had expression measured. Among these genes, 11 had U-scores ≤ 0.05, accounting for 12.79% of the T2D-mapped genes. The t-test showed that this significantly exceeded the expected percentage (5%) with p-value = 0.017. Similarly, 19 T2D-mapped genes, accounting for 22.09%, were found to have U-scores ≤ 0.10, which was significantly higher than the expected percentage (10%) with p-value = 0.004. These results are shown in Table 5. This analysis suggested that T2D-mapped genes from the GWAS catalog ranked significantly higher than random genes using differential expressions.
The USGSA (type 2) test was conducted on the KEGG category to identify pathways enriched for differentially expressed genes. After adjusting for multiple testing by permutation, no KEGG pathway attained significance using α = 0.05 (results not shown). If we expanded the analysis to all categories, the strongest gene set was “Neighborhood of SPINK1” with PID = 2700 (MSigDB, http://software.broadinstitute.org/gsea/msigdb/cards/GNF2_SPINK1), which had U-scores ≤ 0.05 for 70% of the component genes, an enrichment effect = 0.65, an unadjusted p-value = 2.40E−16, and a permutation adjusted p-value < 1E−5. The SPINK1 gene set originated from the mining of coexpressed genes (Liberzon et al. 2011) and belongs to the computational category. This gene set contains 27 component genes, most of which encode proteins secreted by the pancreas; the gene mapping annotations based on GRCh37 are summarized in Table S4. However, the pathway function is not certain because the gene set was computationally generated. Therefore, we performed the CGEA (type 1) test on the component genes and attempted to map the SPINK1 gene set to KEGG pathways. Our analysis showed that the KEGG “Glycerolipid metabolism” pathway with PID = 2756 (KEGG, http://www.genome.jp/dbget-bin/www_bget?hsa00561) was significant with unadjusted and adjusted p-values of 8.05E−07 and < 1E−3, respectively. Glycerolipid metabolism is involved in the pathogenesis of T2D (Prentki and Madiraju 2008). Thus, annotation studies of genome-wide expression data using snpGeneSets can enhance the understanding of an established pathway (e.g., KEGG “Glycerolipid metabolism”) and help to identify pathway functions of annotated gene sets (e.g., SPINK1 and its neighborhood genes in the T2D pathogenesis).
Features and comparison between other tools and packages
Various tools and packages are currently available for genetic annotation and postanalysis of GWS data. The NCBI dbSNP (Sherry et al. 2001), Entrez Gene, and MSigDB (Liberzon et al. 2011) databases provide comprehensive and specialized annotation for SNPs, genes, and biological pathways, respectively. The UCSC Genome Browser (Fujita et al. 2011) and Ensembl BioMart (Kinsella et al. 2011) facilitate the access to these annotations by a user-friendly interactive web search. Particular packages, e.g., GSEA (Subramanian et al. 2005) and MAGENTA (Segre et al. 2010), analyze gene set enrichment for differential gene expressions and SNP associations. Unlike these tools and packages, snpGeneSets integrates heterogeneous annotation data from different sources, supports fast and efficient annotation-based studies on large scale genomic data, and simplifies post-GWS annotation and analysis in a unified platform. This is much more efficient than using multiple tools to access genetic annotations of SNPs, genes, and pathways, perform relation mapping among them, and conduct enrichment analysis.
The snpGeneSets package is focused on SNPs, genes, and pathways. Many GWAS-identified SNPs lie within noncoding genomic regions; annotations for noncoding variants and epigenetic factors, including transcription factor binding sites, DNA methylation sites, and histone modification regions, will further enhance post-GWS annotation and analysis. Cscan (Zambelli et al. 2012), HaploReg (Ward and Kellis 2012), and RegulomeDB (Boyle et al. 2012) identify epigenetic factors related to a list of SNPs or genes. The ENCODE ChIP-Seq Significance Tool identifies the transcription factors enriched in genes based on public ENCODE data (Auerbach et al. 2013). snpGeneSets can be used with these packages and tools to provide a comprehensive understanding of genome-wide SNP association and expression findings and perform effective post-GWS analysis.
Conclusions
We developed an open-source R package named snpGeneSets that annotates and conducts enrichment analysis on GWS results. The package integrates local copies of the annotation knowledge bases for SNPs, genes, and gene sets, and implements three main types of annotations, genomic mapping, mapping relation, and pathway enrichment with auxiliary functions. The package was open-designed and can be easily extended to broaden its application. We applied snpGeneSets to T2D data from the NHGRI GWAS catalog, a GWAS from dbGaP, and a GWES from GEO to demonstrate its utility in interpreting GWS results and enhancing the understanding of genetic effects.
Acknowledgments
This study was supported by grants N01-HC55021 and U01-HL096917 from the National Institutes of Health (NIH)/NIH Heart, Lung, and Blood Institute, and Mississippi IDeA Network of Biomedical Research Excellence grant P20GM103476. The funders had no role in study design, data collection, and analysis, the decision to publish, or preparation of the manuscript. The authors declare that they have no competing interests.
Footnotes
Supplemental material is available online at www.g3journal.org/lookup/suppl/doi:10.1534/g3.116.034694/-/DC1.
Communicating editor: C. L. Myers
