


Abstract
Advanced intercross populations, in which multiple inbred strains are mated at random for many generations, have the advantage of greater precision of genetic mapping because of the accumulation of recombination events across the multiple generations. Related designs include heterogeneous stock and the diversity outcross population. In this article, I derive the two-locus haplotype probabilities on the autosome and X chromosome with these designs. These haplotype probabilities provide the key quantities for developing hidden Markov models for the treatment of missing genotype information. I further derive the map expansion in these populations, which is the frequency of recombination breakpoints on a random chromosome.
Advanced intercross populations, in which multiple inbred strains are mated at random for many generations, have the advantage of greater precision of genetic mapping because of the accumulation of recombination events across the multiple generations. The most commonly used form, which begins with two inbred strains, was formally introduced by Darvasi and Soller (1995) and called advanced intercross lines (AIL). A closely related design is that of heterogeneous stock (HS; see Mott et al. 2000), in which eight inbred strains are randomly mated for many generations. Svenson et al. (2012) developed the diversity outcross population (DO), which was formed with progenitors that were partially inbred individuals drawn from intermediate generations in the development of the Collaborative Cross (so-called pre-CC mice; see Aylor et al. 2011).
The mapping of quantitative trait loci in such populations, whether by interval mapping (Lander and Botstein 1989) or Haley-Knott regression (Haley and Knott 1992), generally requires conditional genotype probabilities at putative quantitative trait loci, given the available marker genotype data. Such probabilities are often calculated using a hidden Markov model (HMM; see Broman and Sen 2009, App. D). An HMM for this purpose formally requires the calculation of two-locus diplotype probabilities, although if the populations are formed with a large number of mating pairs, the two haplotypes within an individual are independent, and so it is sufficient to calculate two-locus haplotype probabilities.
Darvasi and Soller (1995) derived the two-locus haplotype probabilities for the autosome in AIL. I am not aware of any work considering the X-chromosome. In this article, I derive the two-locus haplotype probabilities for the autosome and X-chromosome in AIL, HS, and the DO. The calculations for the DO rely on recent results on haplotype probabilities in pre-CC mice (Broman 2012). Throughout, I assume an effectively infinite set of mating pairs at each generation, no sex difference in recombination, and no selection or mutation.
Now I turn to the unbalanced case for the X-chromosome, in which all F1 individuals are derived from the cross female A × male B, so that all F1 males are hemizygous A. This appears to be widely used in practice (e.g., Norgard et al. 2008; Kelly et al. 2010). The calculations are more difficult, because the allele frequencies are different in males and females and across generations.
I first calculate the single-locus allele frequencies. Let qs be the frequency of the A allele in females at generation Fs. Note that the frequency in males at Fs is qs−1. The initial values are q0 = 1 and , and we have the recurrence relation , which comes from the fact that a random allele drawn from the female at generation Fs+1 is equally likely to be an allele from the female or male at generation Fs, and the allele in the male at Fs is a random allele from the female at Fs−1. The solution of the recurrence relation is , for s ≥ 0.
Note the distinction between equations (3) and (5): if a recombinant haplotype is transmitted from the Fs female, the chance that it brings two A alleles together depends on the frequency of the A allele in males and females in the Fs−1 generation. In the balanced case, these are each ; in the unbalanced case, they are different from each other and vary across generations.
I have been unable to obtain closed-form solutions for and . However, the values can be quickly calculated numerically, using equation (5). Note that .
Haplotype probabilities in the DO are calculated similarly. The progenitors for the DO were pre-CC mice. I assume a large number of progenitors, that they were drawn from independent lines, and that the order of the crosses that generated the different lines were random, giving complete balance across the eight alleles.
In a potential abuse of notation, I will redefine the q, p, m, and f variables used previously. Let qk denote the frequency of the AA haplotype at generation G2:Fk in the pre-CC; this is times the haplotype probability in Table 4 of Broman (2012). Let ps be the probability of the AA haplotype at generation s of the diversity outcross.
The pre-CC progenitors of the DO were drawn from independent lines at a variety of different generations along the course to inbreeding. Let αk denote the proportion of the pre-CC progenitors that were at generation G2: Fk, and note that a pre-CC progenitor at generation G2: Fk will transmit the AA haplotype with frequency qk+1 (that is, the frequency of the AA haplotype at generation G2: Fk). Thus, the frequency of the AA haplotype at the first generation of the DO is .
Note that the recombinant haplotypes are all equally likely, due to the random order of the initial crosses, and so each has probability (1 − 8ps)/56.
HS corresponds to the DO with α1 = 1 (that is, k ≡ 1), in which case p1 = q2 = 7 − 24r + 24r2 − 8r3.
Again, HS corresponds to DO with α1 = 1, in which case f1 = (4 − 5r + r2)/32 and, m1 = (2 − 3r + r2)/16.
In Figure 1, the probabilities of recombinant two-locus haplotypes are displayed for the different populations. For the DO, I used the distribution of k as in Figure 1 of Svenson et al. (2012) and s = 5. For HS and AIL, I used s = 10 and 12, respectively, to match the total number of generations with recombination—the average k in Svenson et al. (2012) was six. Recombinant haplotypes are more frequent on the autosome, and are more frequent in HS than in the DO; inbreeding in the pre-CC progenitors of the DO is accompanied by a loss of recombinants.
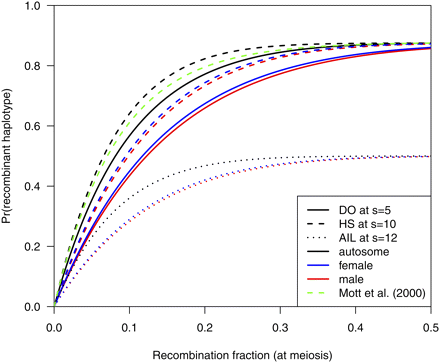
Frequency of a two-locus haplotype being recombinant, as a function of the recombination fraction at meiosis, for the diversity outcross population at s = 5 (solid curves), heterogeneous stock at s = 10 (dashed curves), and balanced AIL at s = 12 (dotted curves), for the autosome (black), male X (blue), and female X (red). The green dashed curve is the recombinant frequency for HS at s = 10 assumed in Mott et al. (2000).
It is particularly interesting to consider the map expansion in these populations, which is the frequency of recombination breakpoints on a random chromosome. Let R denote the probability of a recombinant haplotype; then the map expansion is (see Teuscher and Broman 2007). The map expansion on an autosome in AIL is s/2. For the DO, on an autosome, the map expansion satisfies , where M1 is the weighted average (with weights αk) of the map expansion in the pre-CC at generation G2: Fk+1 (see Broman 2012, Table 4). For the particular progenitors detailed in Svenson et al. (2012, Figure 1), this is approximately (7s +37)/8. For HS, we have M1 = 3 and .
The aforementioned haplotype probabilities provide the key quantities for developing HMMs for advanced intercross populations. However, it should be noted that there are other approaches to handling such data. For example, Besnier et al. (2011) used a variance components model to analyze outbred chicken AIL data, with identity-by-descent probabilities calculated using a modified version of the method of Pong-Wong et al. (2001), for general pedigree data.
The aforementioned result for HS differs from that in Mott et al. (2000) and incorporated into the HAPPY software. They had assumed that the map expansion in HS was , whereas I show it to be . In the first three of generations with recombination, individuals are fully heterozygous, and so all recombination events can be seen; in the subsequent s − 1 generations, there is a 1/8 chance of homozygosity and so only 7/8 of recombination events can be seen.
Mott et al. (2000) further assumed that the transition probabilities along an HS chromosome are a function of genetic distance, but that requires knowledge of the map function. It is more direct to express the transition probabilities in terms of the recombination fraction at meiosis.
The green curve in Figure 1 displays the probability of a recombinant haplotype assumed in Mott et al. (2000) for HS with s = 10 when the map function corresponding to the gamma model with the level of crossover interference estimated for the mouse in Broman et al. (2002) is used. The probability is slightly smaller than that from my calculations; at r = 0.01, the equation in Mott et al. (2000) gives 0.099, whereas I obtain 0.103.
I have assumed an effectively infinite number of mating pairs at each generation. In practice, with a finite number of mating pairs, there will be some inbreeding and so an increased frequency of homozygosity and a decreased frequency of recombination. In addition, the individuals at the final generation will include siblings, and the relationships among individuals might be used to improve the genotype reconstruction. In practice, for computational efficiency, both the inbreeding and the relationships among individuals would probably be ignored in the genotype reconstruction, and with dense genotype data, there will be little loss of information.
Acknowledgments
James Crow generously provided comments for improvement of the manuscript. This work was supported in part by National Institutes of Health grant GM074244.
